Wave graphs, Waveace 12, Displaying wavegraphs – Teledyne LeCroy WaveAce EasyScope Operators Manual User Manual
Page 12
WaveAce
12
ES-OM-E-RevA
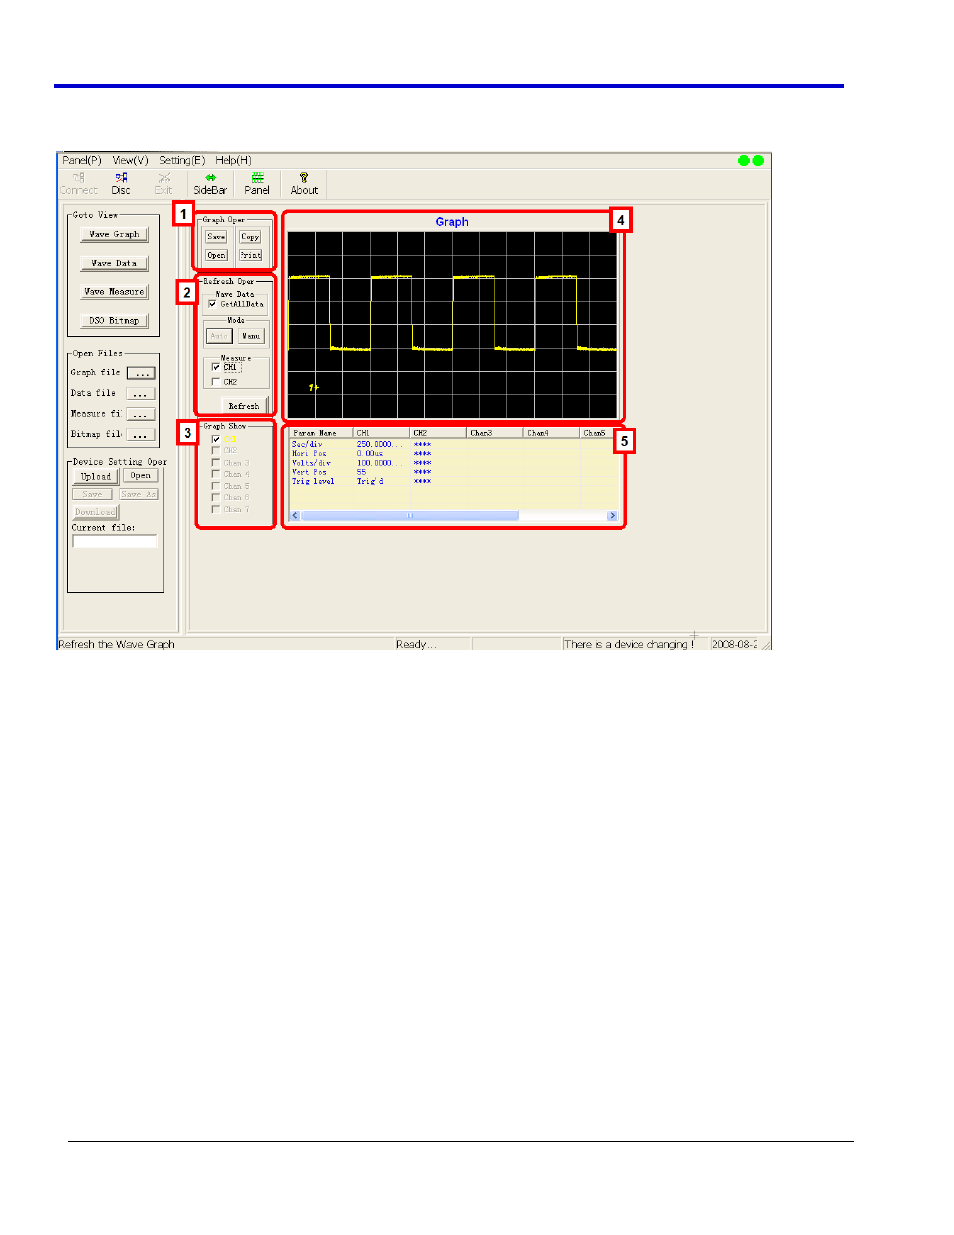
Wave Graphs
You can use the Wave Graph function to view waveforms.
1.
Graph Oper - lets you save, copy, open, and print waveform graphs.
2.
Refresh Oper - lets you obtain and display waveform graphs.
3.
Graph Show - lets you indicate the channels you want to display in the Graph display area.
4.
Graph Display - displays the waveform graph(s).
5.
Parameters - displays the waveform parameters for the selected channels, such as Sec/div, Horizontal
position, Volts/div, Vertical Position, and Trigger Level.
Displaying WaveGraphs
When displaying waveform graphs, there are two modes: Auto and Manual. Auto mode automatically refreshes
the waveform and parameter data using the Refresh Rate setting. Manual mode, the default mode, the
waveform graph and data are refreshed once each time you press the Refresh button.
PLEASE NOTE THE FOLLOWING:
If you use Auto mode, do not press the RUN/STOP front panel or Virtual Panel button. When you stop the
acquisition, EasyScope will not be able to automatically refresh.
If you want to change the Refresh Rate for Auto mode, make sure you set the display mode to Manual.
Then, change the Refresh Rate and set it to Auto mode.
1.
To display waveform graphs, click the Wave Graph button on the Base Control Panel.
2.
Click GetAllData.
3.
If you want to automatically refresh the waveform, click Auto.
OR
If you want to manual refresh the waveform, click Manual.
4.
To display waveform measurements in the parameter table below the graph, click CH1 and/or CH2.
5.
Choose the channels you want to display in the Graph Show area. The channels you selected are
displayed in the Graph display area