Luminex MasterPlex CT Tutorial Manual User Manual
Page 18
http://www.miraibio.com
Plex
GT
18
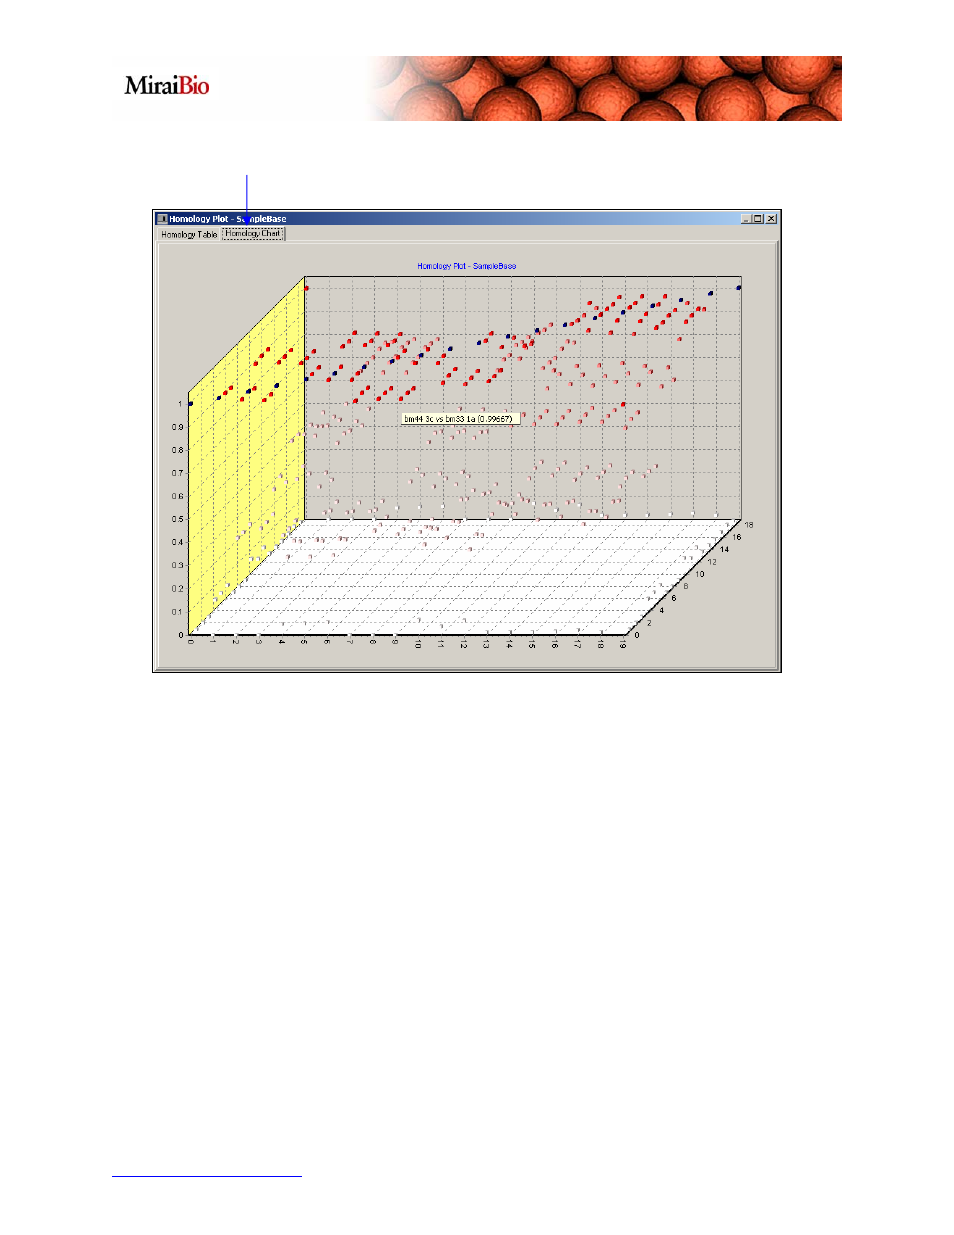
Homology Chart Tab
To view a 3D graphical representation of the Homology Table, press the Homology
Chart tab. The y-axis represents the correlation coefficient from zero to one. The x-
axis and z-axis represent each locus in the order they are presented in the Homology
Table under Well Name or Sample Name.
Master