Luminex MasterPlex CT Tutorial Manual User Manual
Page 15
http://www.miraibio.com
Plex
GT
15
MasterPlex GT offers two ways of analyzing and comparing a pair of samples or alleles
in the Graph window:
1) Sample by Sample – View the scatter plot of 2 selected samples
2) Allele by Allele – View the scatter plot of 2 selected alleles
Two-Sample Comparison Mode
Sample by Sample Tab
Correlation Coefficient
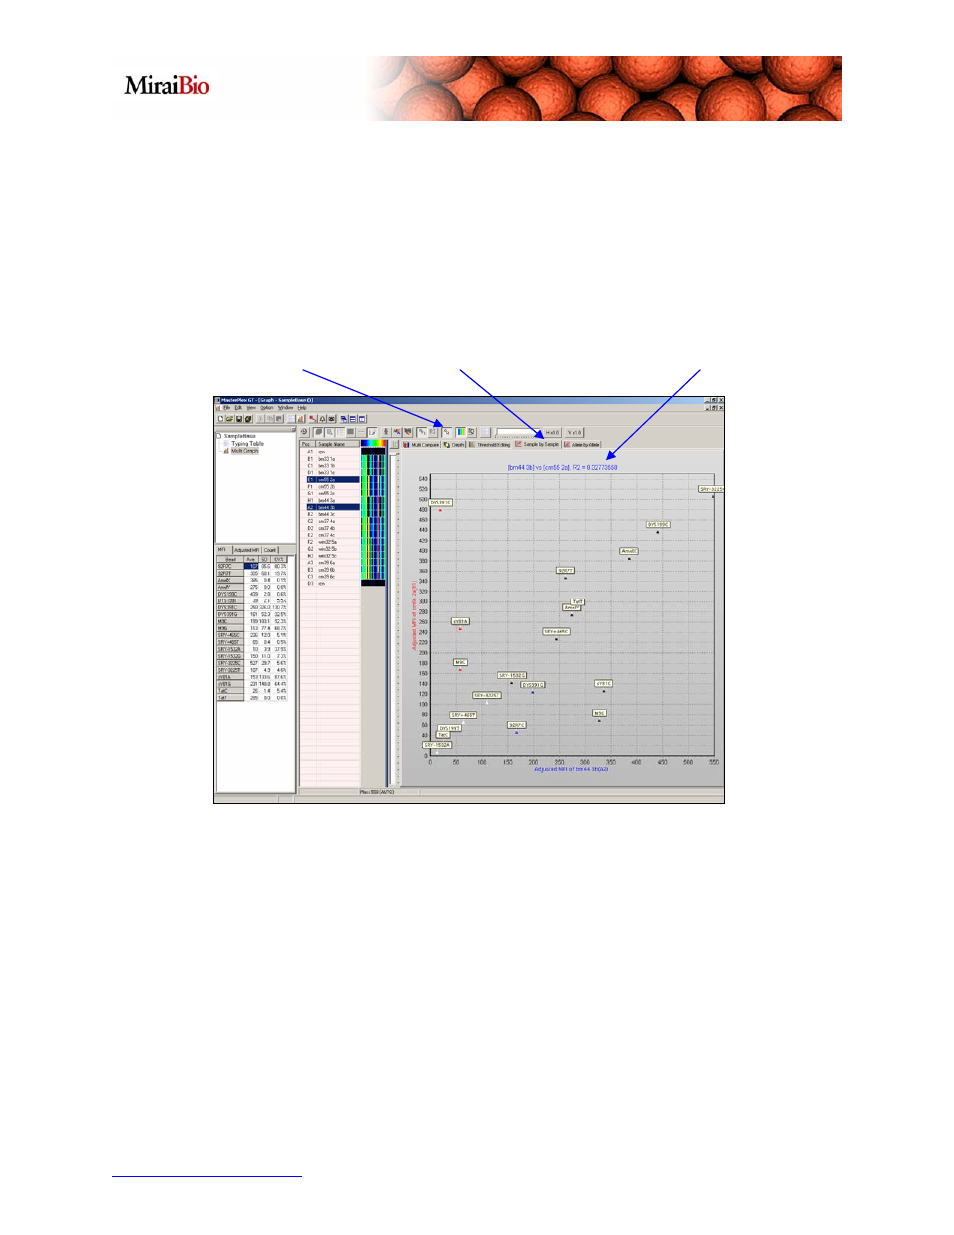
To begin comparison of two samples, press the Two-Sample Comparison Mode icon
and then click on the Sample by Sample tab. Next, select E1 and A2 from the Sample
Name table and this will bring up the scatter plot with the Correlation Coefficient
located on the top. The labels for each data point will appear if you click on the graph.
Here is a breakdown for the color-coding of the data points:
White points – Alleles that are not called in either sample.
Red points – Alleles called in the Y-axis sample only.
Blue points – Alleles called in the X-axis sample only.
Black points – Alleles called in both samples.
Master