Luminex MasterPlex CT Tutorial Manual User Manual
Page 12
http://www.miraibio.com
Plex
GT
12
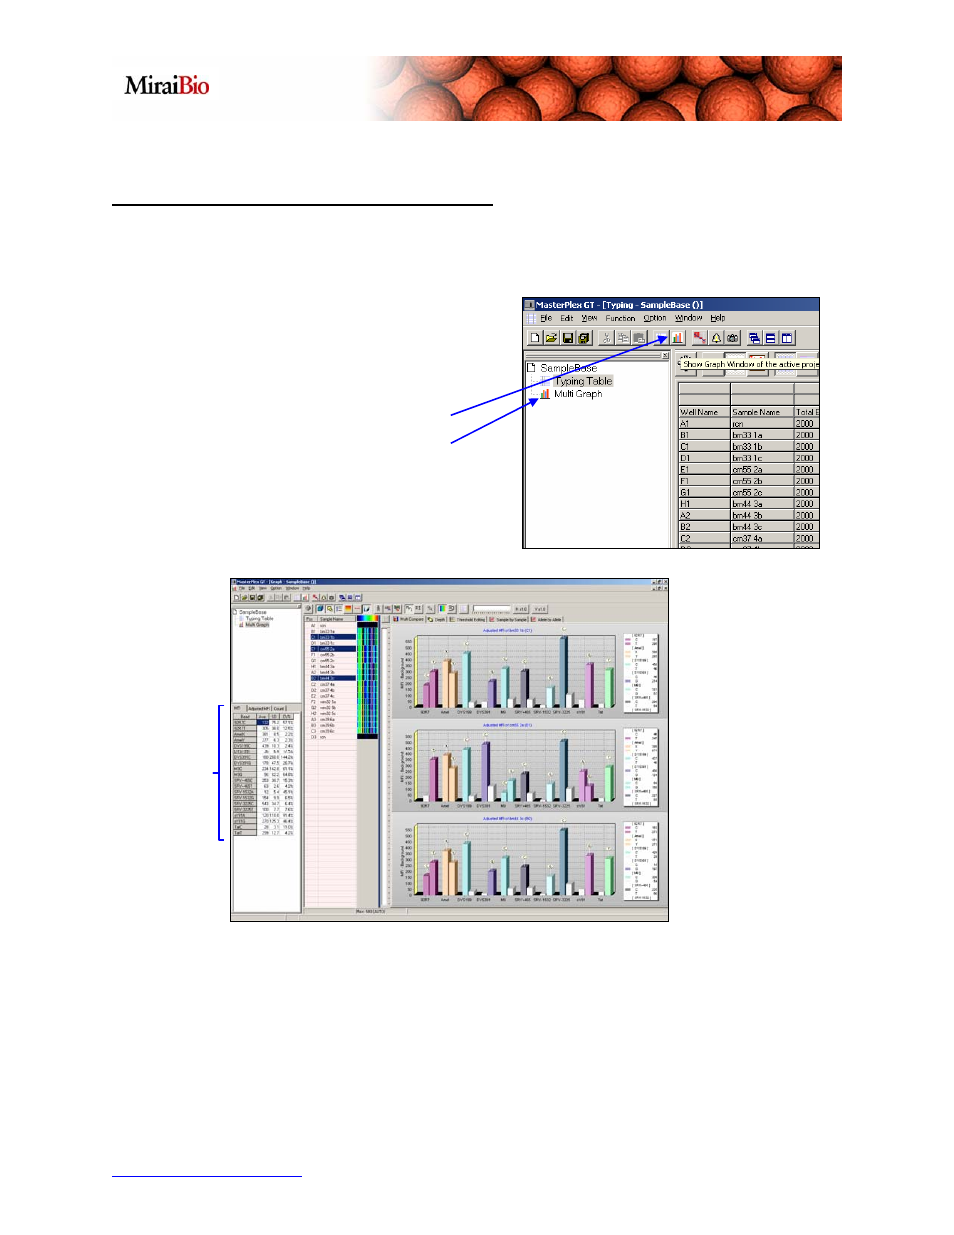
Analyzing the Data with the Graph Window
MasterPlex GT enables the user to view the data in the form of bar graphs (2D and
3D), heatmaps, and scatter plots.
There are two ways of opening the Graph
window:
Clicking on the Show Graph icon
Clicking on the Multi Graph link
The Graph window will initially be empty when it appears. To view the individual bar
graphs for each sample, click on the corresponding samples under the Sample Name
table. To select multiple samples, hold down the Ctrl key and left-click. Please note
that the on-the-fly statistical calculations for the selected samples are also available
here on the left side of the screen.
Master