Luminex MasterPlex CT Tutorial Manual User Manual
Page 14
http://www.miraibio.com
Plex
GT
14
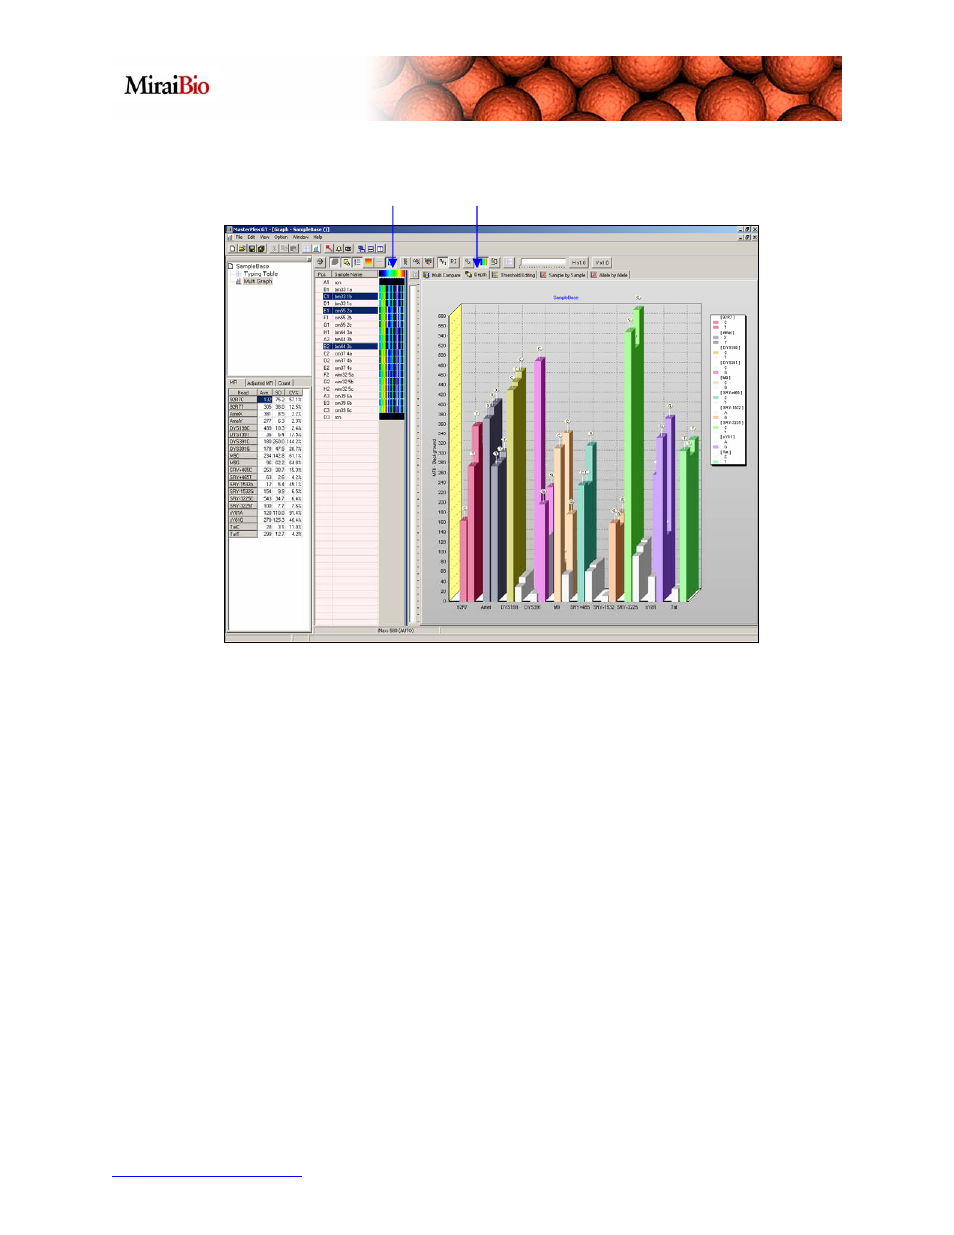
Heatmap Depth Bar Graph Tab
The Heatmap is automatically displayed in the Graph window. It shows the intensity of
the MFI Percentage for each allele based on the Heatmap Color Indicator which goes
from black to red with red indicating the highest percentages. To view the locus names,
just hover over the each color panel with the mouse and a label will appear with the
locus name, MFI value, and Percentage of total MFI for each allele.
Press the Depth Bar Graph tab to view and compare all the selected samples in one
chart.
Master