Luminex MasterPlex CT Tutorial Manual User Manual
Page 16
http://www.miraibio.com
Plex
GT
16
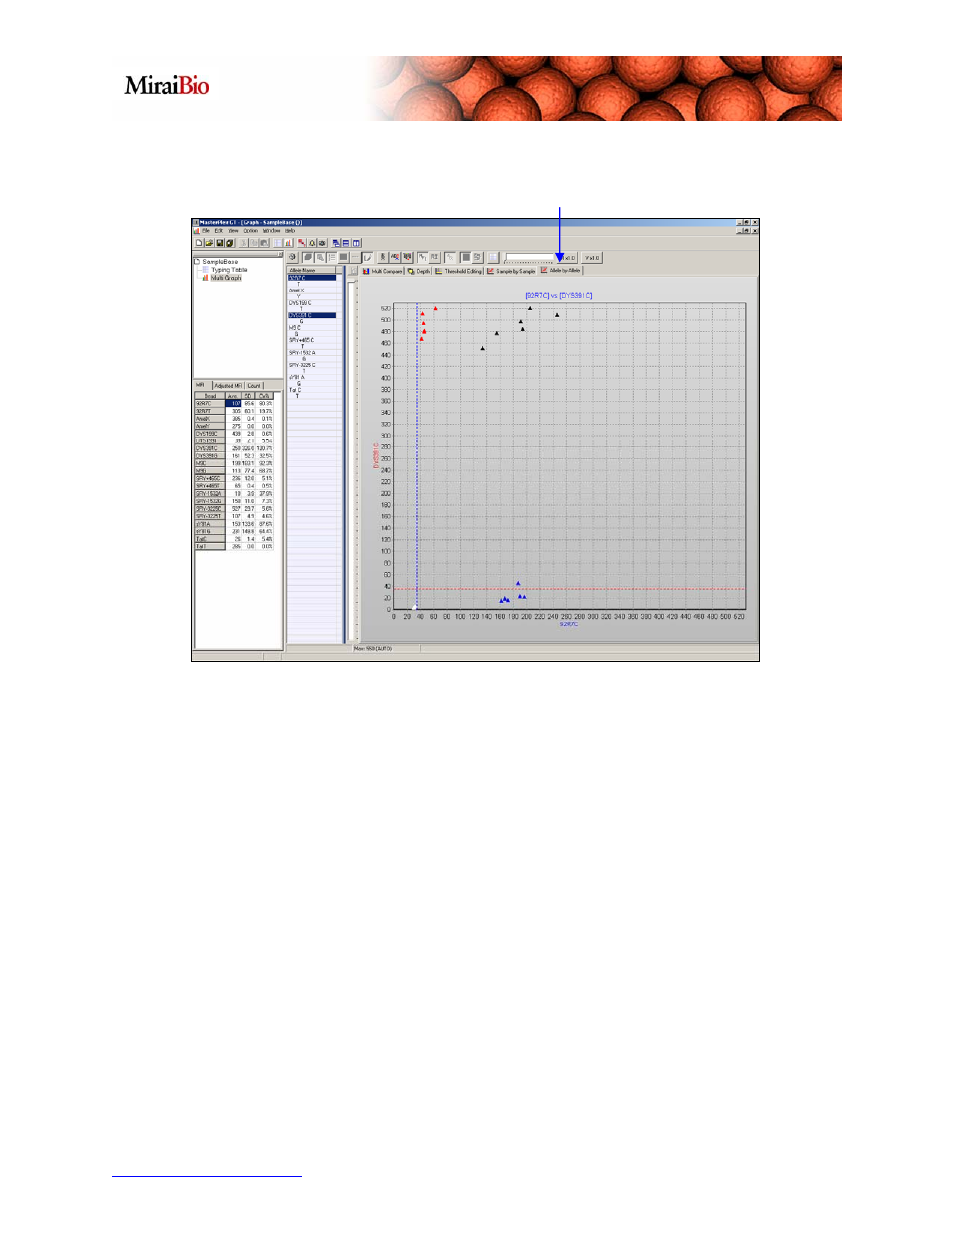
Allele by Allele Tab
To perform analysis of two alleles, press the Allele by Allele Tab. Next, select 92R7 C
and DYS391 C from the Allele Name table. This will bring up the scatter plot for the
two alleles. The labels for each data point will appear if you click on the graph. The
color codes are exactly the same as for Sample by Sample analysis:
White points – Alleles that are not called in either sample.
Red points – Alleles called in the Y-axis sample only.
Blue points – Alleles called in the X-axis sample only.
Black points – Alleles called in both samples.
Note: To Print Chart, Copy the Chart to a file, or Add To Report (Refer to the
Printing Reports section on page 19 for more details on this), just right-click and make
the desired selection.
Master