2d calibration tables, 4 overview – MoTeC M8 User Manual
Page 6
4 Overview
Load. Various other calibration tables will also affect the fuel injector pulse
width.
A typical 3 dimensional fuel calibration table is shown below.
RPM
LOAD
0 500 1000 1500 2000 2500 3000 3500 4000 4500 5000 5500 6000 6500 7000
100
38.0 40.0 41.0 43.0 45.5 55.0 53.0 55.0 56.5 58.0 59.5 60.5 62.0 64.0 62.0
90
38.0 39.0 40.0 42.0 42.0 50.0 50.5 51.0 52.5 52.5 55.5 57.5 59.5 61.5 59.5
80
38.0 39.0 39.5 41.5 40.5 45.5 48.0 45.5 46.5 49.0 51.5 53.5 55.5 56.0 55.5
70
38.0 38.5 39.0 40.0 38.5 42.5 43.5 43.0 43.0 43.5 46.5 44.5 44.0 44.5 44.0
60
38.0 38.0 39.0 39.5 37.5 38.0 41.0 41.0 41.5 41.0 43.5 42.5 41.5 42.0 41.5
50
38.0 38.0 38.5 39.0 37.0 36.0 39.0 39.5 39.0 40.0 41.0 39.0 38.0 38.0 38.0
40
32.0 31.5 32.0 33.0 32.0 31.0 33.0 34.0 33.5 34.5 35.5 34.5 33.5 33.5 33.5
30
25.5 26.0 25.5 27.0 26.0 27.0 28.0 29.0 28.5 28.0 28.0 28.0 28.0 27.0 28.0
20
20.5 21.0 29.5 20.5 21.5 22.5 22.5 25.5 27.5 27.0 26.0 27.0 26.0 25.0 26.0
10
18.0 17.5 17.0 18.5 18.5 19.5 19.5 22.0 24.0 24.5 24.5 24.5 24.5 22.5 24.5
0
14.0 14.0 14.5 15.0 15.5 16.5 18.0 20.0 20.0 21.0 20.5 20.0 20.0 19.5 20.0
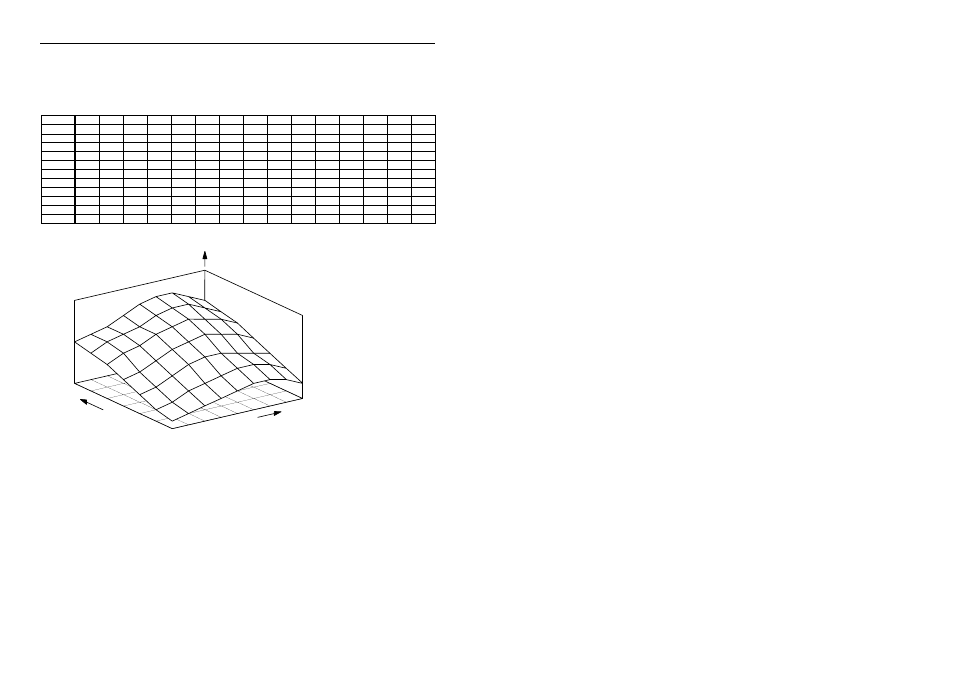
The calibration tables may be represented graphically as shown below.
RPM
LOAD
FUEL
The ECU determines the amount of fuel to inject by first calculating the RPM
and Load then extracting the corresponding value from the table. If the RPM
and Load do not match an RPM and LOAD point exactly then the values from
the closest sites are mathematically interpolated to arrive at an intermediate
value.
2D Calibration Tables
2D calibration tables have 3 load sites only : Light Load, Full Load and Boost.
2D calibration is not as precise as 3D calibration, a more accurate result will
be obtained using 3D calibration.