Split-screen display, Listen, view, measure – Atec Rohde-Schwarz-ESIB Series User Manual
Page 6
6
EMI Test Receivers ¸ESIB
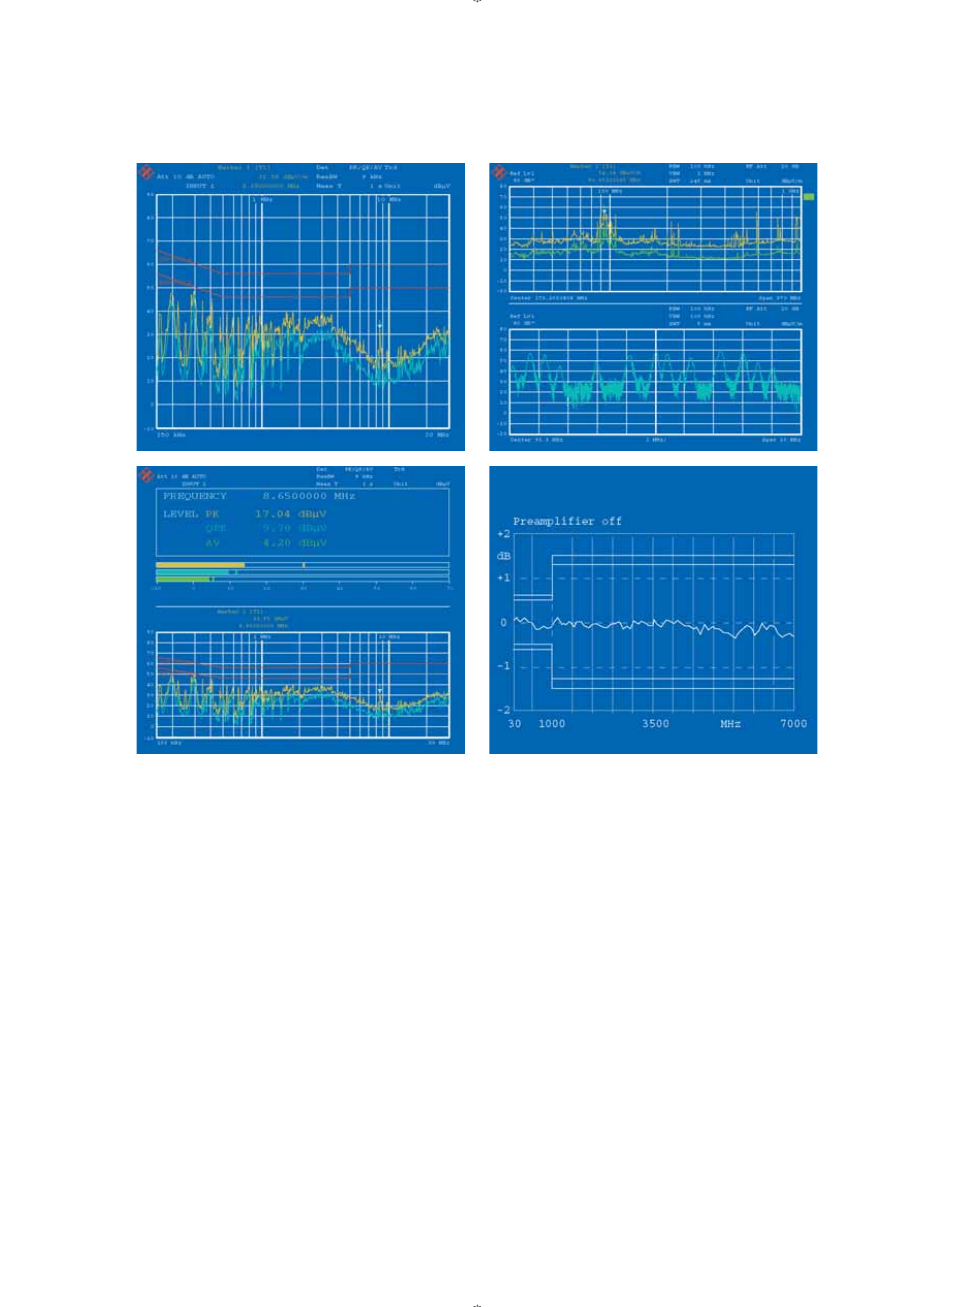
Split-screen display
Critical emissions can be measured with
numeric display of frequency and level
as with classic receivers. Bargraphs
provide an analog display of measured
values for the various detectors simulta-
neously and in different colors (Fig. 9).
By coupling the marker in the overview
spectrum to the receiver frequency,
emissions can be measured fast and reli-
ably in line with standards.
In the second window, the operator can
zoom in on the displayed trace (Fig. 10).
Zooming is effected either based on
stored measured data or by means of a
new measurement with the selected de-
tectors. If stored data is used, all stored
values can be displayed. For this, the
¸ESIB can store up to 250 000 mea-
sured values with one trace active in
background operation. This considerably
reduces measurement time, since no
new measurement is needed to make a
detailed analysis.
Listen, view, measure
To analyze the spectrum and to exclude
ambient noise, such as originating from
sound or TV broadcast transmitters or
the like, it is expedient to select single
frequencies by means of the markers,
tune the receiver frequency to the mark-
er frequency, and activate the audio
path with the built-in AM/FM demod-
ulator by switching on the loudspeak-
er or headphones. Acoustic identifi ca-
tion is very frequently and successfully
used in EMI signal analysis, all the more
so since manual pre-/postmeasurements
and interactive operation support this
approach.
8
10
9
11
ESIB_dat_en.indd 6
04.01.2006 13:27:21