Figure 2, 25 ºc (typical) 7 – Atec Agilent-ECP-E26A User Manual
Page 23
Introduction
1
Agilent E4412A and E4413A Power Sensors Operating and Service Guide
7
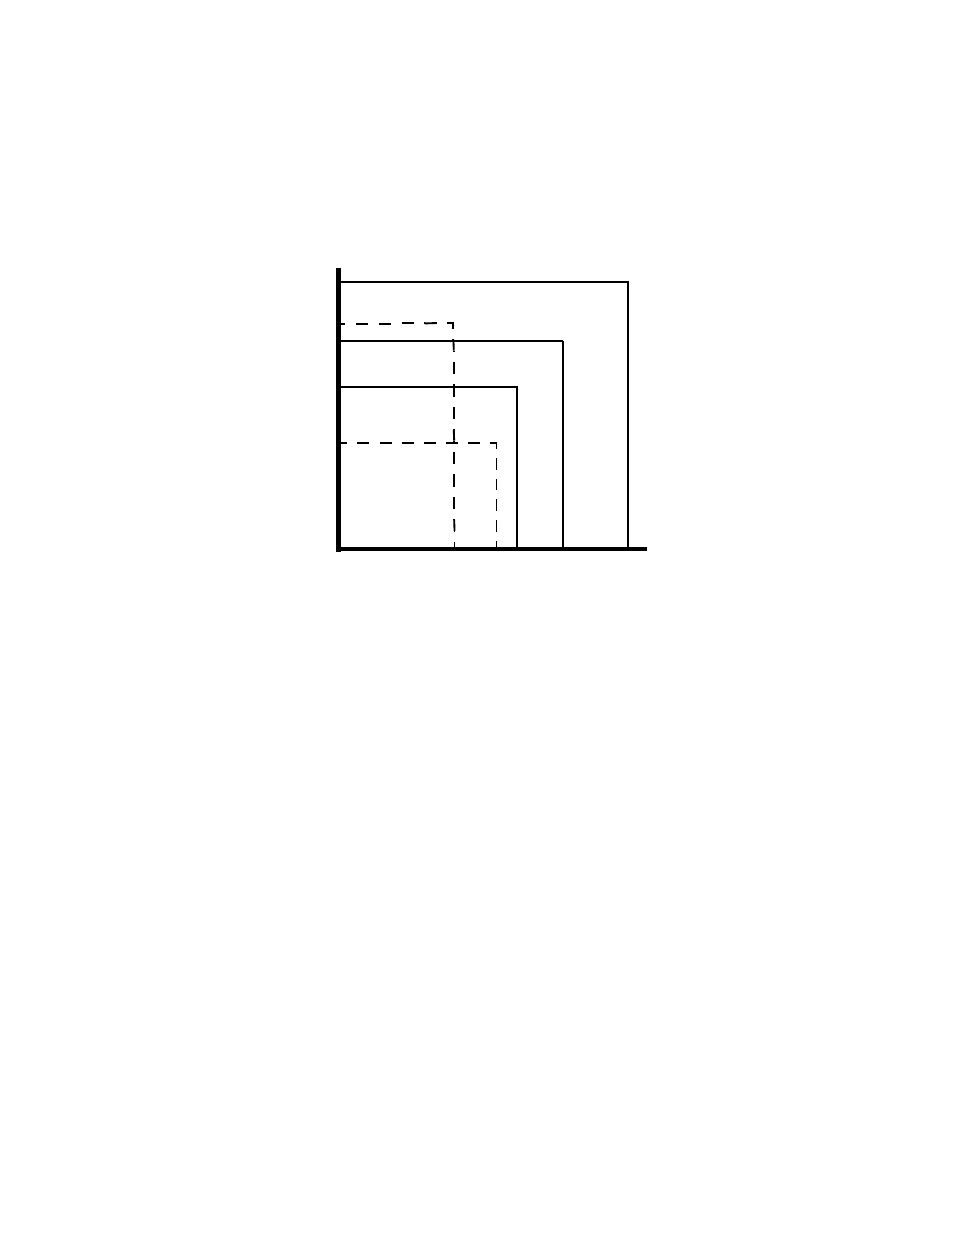
Figure 2
Relative Mode Power Measurement Linearity with Power Meter/Sensor at
25 ºC (Typical)
The chart in
shows the typical uncertainty in making relative power
measurements with the E44XX- Series power meter in the Rel (relative) mode.
In a relative measurement, two power levels are compared using a single
sensor. The typical measurement uncertainty can be found by drawing a
vertical line at a power level used as a reference, and a horizontal line at the
power being measured. The region where these two lines intersect shows the
typical uncertainty. This assumes that the reference power and the measured
power are at the same frequency, and neglects errors due to zero set, zero
drift, and noise. It also assumes no change in mismatch when measuring the
“Power level used as reference” and the “Power level being measured”. This
chart illustrates that the best relative power measurement accuracy is
obtained when the reference and the measured power levels are equal to, or
less than, –20 dBm. Care in choosing the power levels cna yield improved
measurement accuracy. Example A illustrates a relative gain (amplifier
measurement) and example B illustrates a relative loss (insertion loss
measurement).
±6 %
±3 %
±1 %
+20
+10
+6
0
–20
–35
–70
–35
–70
–20
–25
+20
0
A
B
Po
w
e
r
L
e
v
e
l
B
e
in
g
M
e
a
s
u
r
e
d
(
d
B
m
)
Power Level Used as Reference (dBm)