Characteristic curves – GE Industrial Solutions ESTW015A0F Series User Manual
Page 5
Data Sheet
May 6, 2011
ESTW015A0F Series Eighth-Brick Power Modules
36
–75Vdc Input; 3.3Vdc Output; 15A Output
LINEAGE
POWER
5
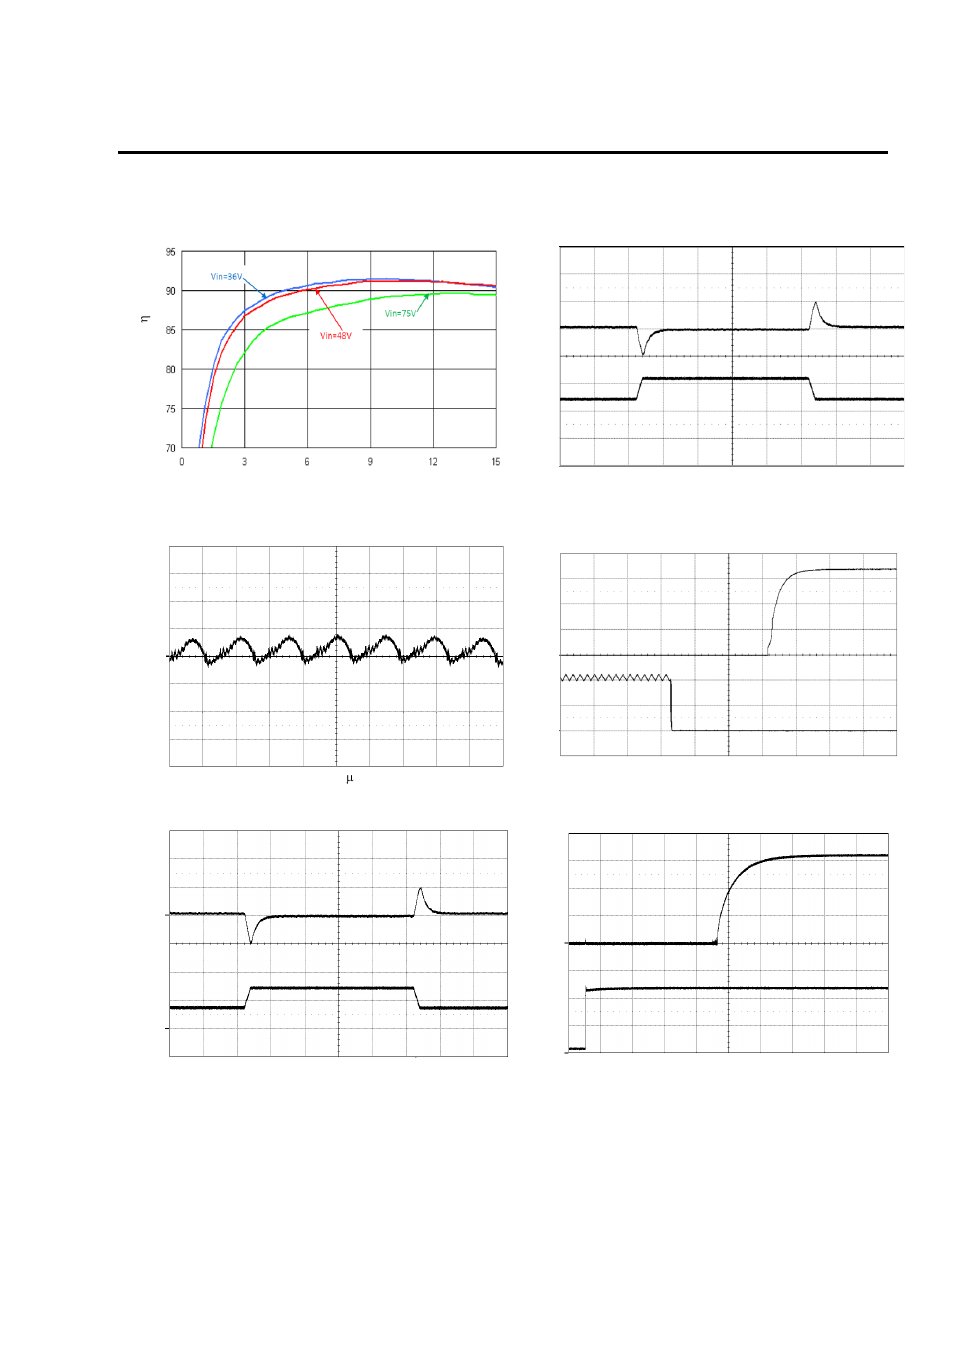
Characteristic Curves
The following figures provide typical characteristics for the ESTW015A0F (3.3V, 15A) at 25
o
C. The figures are
identical for either positive or negative remote On/Off logic.
E
FF
IC
IE
N
C
Y
,
(%
)
OUT
P
U
T
C
UR
RE
NT
OU
T
P
U
T
V
O
L
T
A
GE
Io
(A
) (
5
A
/d
iv
)
V
O
(
V
)
(2
0
0
m
V
/d
iv)
OUTPUT CURRENT, I
O
(A)
TIME, t (200µs/div)
Figure 1. Converter Efficiency versus Output Current.
Figure 4. Transient Response to 0.1A/µS Dynamic
Load Change from 50% to 75% to 50% of full load.
OUT
P
U
T
V
O
L
T
A
GE
V
O
(
V
) (
2
0
m
V
/d
iv
)
On
/Of
f
V
OL
T
A
GE
OU
T
P
U
T
V
O
L
T
A
GE
V
O
(
V
)
(2
V
/d
iv)
V
O
n
/O
ff
(
V
) (
1
V
/d
iv)
TIME, t (2 s/div)
TIME, t (10ms/div)
Figure 2. Typical output ripple and noise (V
IN
= V
IN,NOM
,
I
o
= I
o,max
).
Figure 5. Typical Start-up Using Remote On/Off,
negative logic version shown (V
IN
= V
IN,NOM
, I
o
= I
o,max
).
OUT
P
U
T
C
UR
RE
NT
O
UT
P
U
T
V
OL
T
A
GE
Io
(A
)
(5
A
/d
iv)
V
O
(
V
) (
2
0
0
m
V
/d
iv
)
INP
UT
V
O
L
T
A
GE
OU
T
P
U
T
V
OL
T
A
GE
V
O
(
V
)
(2
0
V
/d
iv
V
IN
(
V
) (
1
V
/d
iv)
TIME, t (200µs/div)
TIME, t (5ms/div)
Figure 3. Transient Response to 0.1A/µS
Dynamic
Load Change from 25% to 50% to 25% of full load.
Figure 6. Typical Start-up Using Input Voltage (V
IN
=
V
IN,NOM
, I
o
= I
o,max
).