Data sheet, Characteristic curves – GE Industrial Solutions EBDW020A0B Barracuda Series User Manual
Page 7
GE
Data Sheet
EBDW020A0B Barracuda™ Series; DC-DC Converter Power Modules
36-75Vdc Input; 12.0Vdc, 20.0A, 240W Output
April 15, 2013
©2012 General Electric Company. All rights reserved.
Page 7
Characteristic Curves
(continued)
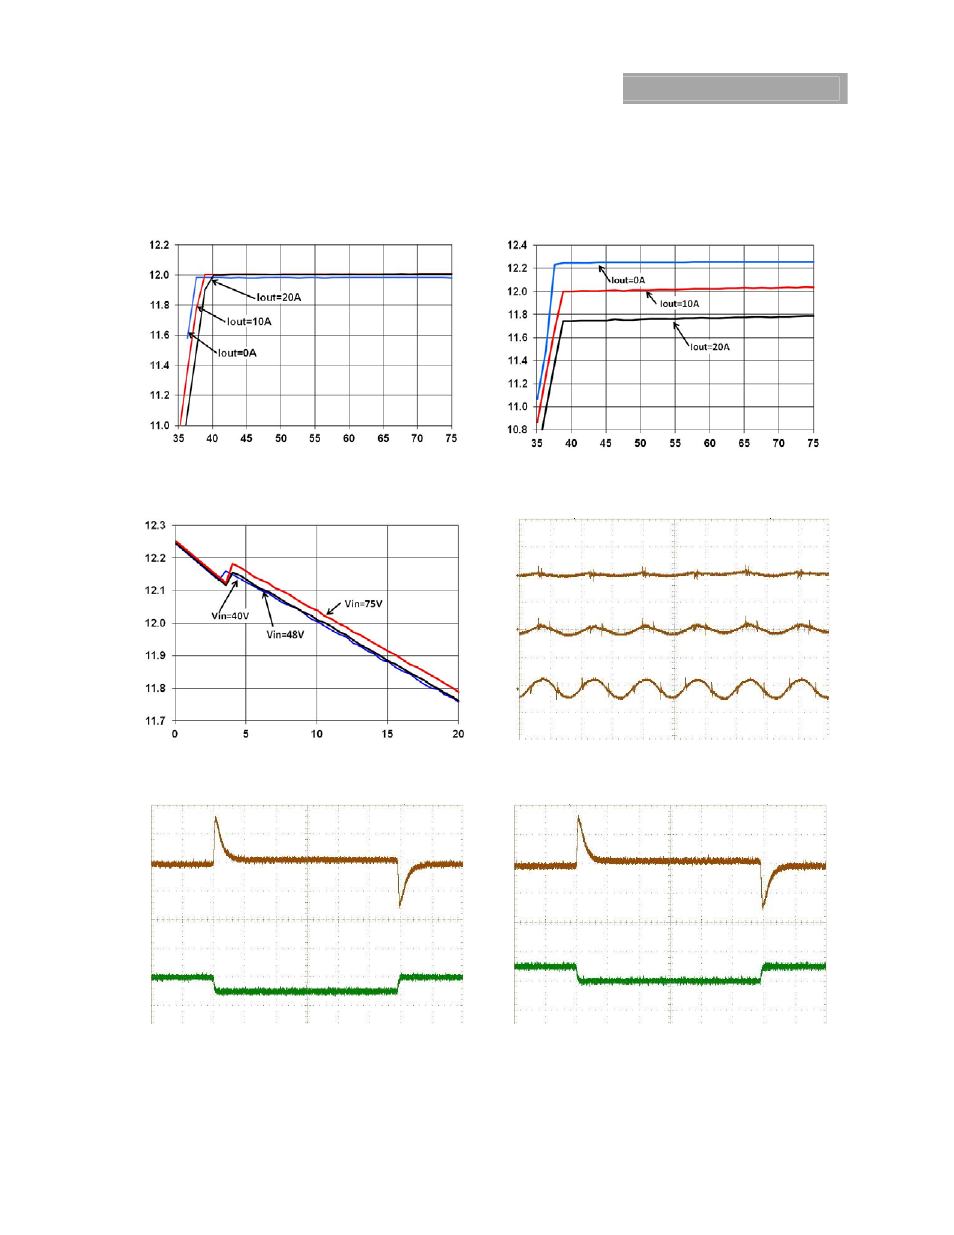
The following figures provide typical characteristics for the EBDW020A0B (12V, 20A) at 25ºC. The figures are identical for either
positive or negative Remote On/Off logic.
OUT
PUT
VOLTAGE,
V
O
(V
)
OUT
PUT
VOLTAGE,
V
O
(V
)
INPUT VOLTAGE, V
in
(V)
INPUT VOLTAGE, V
in
(V)
Figure 7. Typical Output Voltage Regulation vs. Input
Voltage at Room Temperature.
Figure 8. Typical Output Voltage Regulation vs. Input Voltage
for the –P Version at Room Temperature.
OUTPUT VOLTA
G
E, V
O
(V)
OUT
PUT
V
O
LT
AG
E,
V
O
(V
) (5
0m
V/di
v)
OUTPUT CURRENT, I
O
(A)
TIME, t (2s/div)
Figure 9. Typical Output Voltage Regulation vs. Output
Current for the –P Version at Room Temperature.
Figure 10. Typical Output Ripple and Noise at Room
Temperature I
o
= I
o,max
and and C
OMin
.
O
U
TP
UT CURRENT
OUTPUT
VOLTAGE
I
O
(A)
(10A/di
v)
V
O
(V
) (2
00
m
V/d
iv
)
OUTPUT CURREN
T OUTPUT
VOLTAGE
I
O
(A)
(10A/di
v)
V
O
(V
) (2
00
m
V/d
iv
)
Figure 11. Typical Transient Response to Step Change in
Load from 25% to 50% to 25% of Full Load at 48Vdc Input
and C
O
= 220uF Polymer, with -02 option.
Figure 12. Typical Transient Response to Step Change in
Load from 50% to 75% to 50% of Full Load at 48Vdc Input
and C
O
= 220uF Polymer, with -02 option.
36 Vin
48 Vin
75 Vin