Varistor products – Littelfuse MLA Automotive Varistor Series User Manual
Page 3
© 2014 Littelfuse, Inc.
49
Revised: January 16, 2014
Varistor Products
MLA Automotive Varistor Series
Surface Mount Multilayer Varistors (MLVs) > MLA Automotive Series
Specifications are subject to change without notice.
Please refer to www.littelfuse.com/series/ML.html or MLA.html for current information.
MLA Automotive Series
Peak Current and Energy Derating Curve
When transients occur in rapid succession, the average
power dissipation is the energy (watt-seconds) per pulse
times the number of pulses per second. The power so
developed must be within the specifications shown
on the Device Ratings and Specifications Table for the
specific device. For applications exceeding 125°C ambient
temperature, the peak surge current and energy ratings
must be derated as shown below.
100
80
60
40
20
0
-55
50
60
70
80
90 100 110 120 130 140 150
PERCENT OF
RA
TED
VALUE
AMBIENT TEMPERATURE (
o
C)
FIGURE 1. PEAK CURRENT AND ENERGY
DERATING CURVE
T
1
T
2
100
50
0
O
1
TIME
PERCENT OF PEAK
VALUE
O
1
= VIRTUAL ORIGIN OF WAVE
t
1
= VIRTUAL FRONT TIME = 1.25 x t
(IMPULSE DURATION)
t = TIME FROM 10% TO 90% OF PEAK
t
2
= VIRTUAL TIME TO HALF VALUE
EXAMPLE:
FOR AN 8/20 s CURRENT WAVEFORM
8 s = t
1
= VIRTUAL FRONT TIME
20 s = t
2
= VIRTUAL TIME TO
HALF VALUE
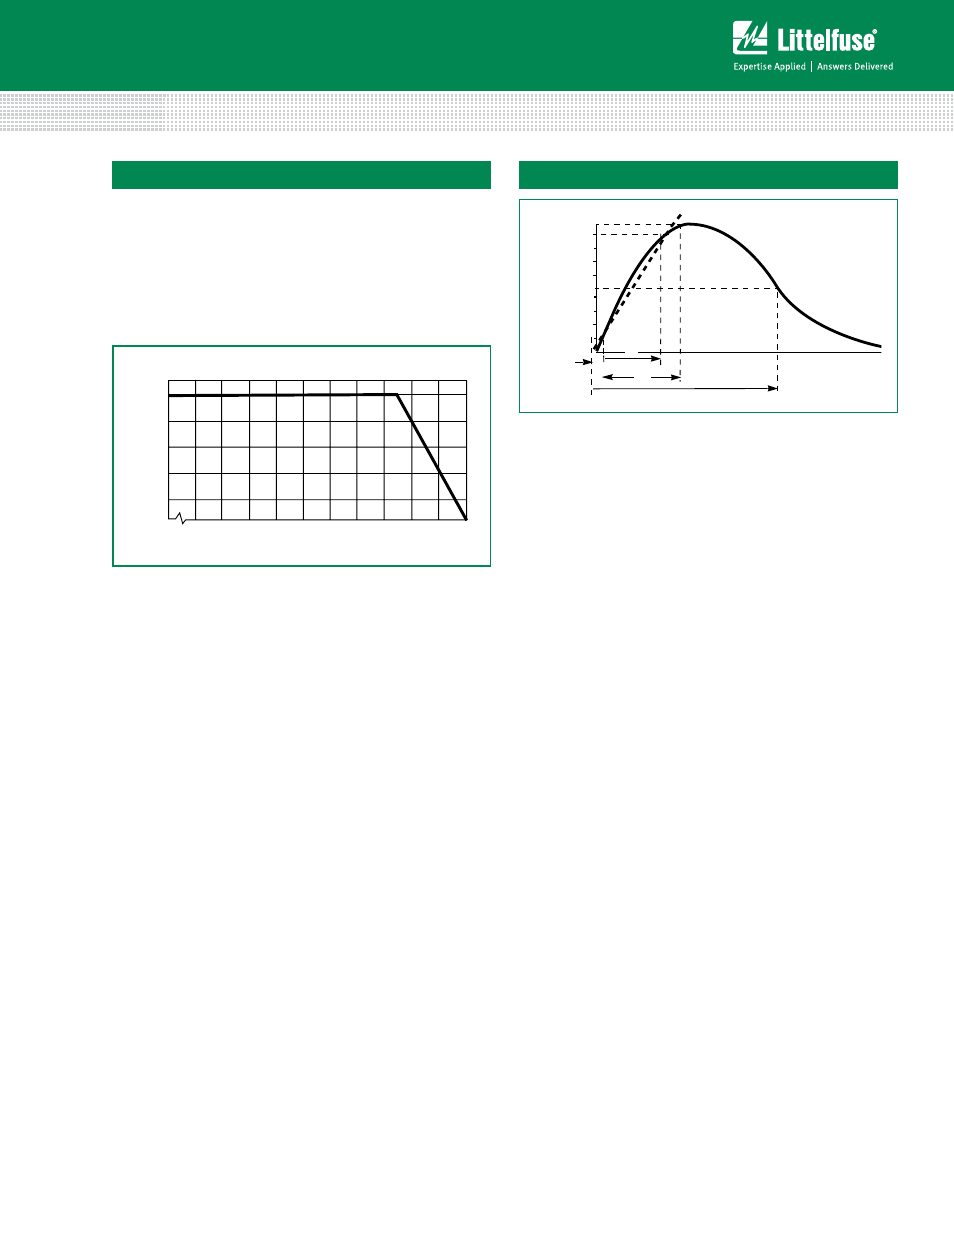
FIGURE 2. PEAK PULSE CURRENT TEST WAVEFORM
FOR CLAMPING VOLTAGE
T
Peak Pulse Current Test Waveform for Clamping Voltage
0
1
= Virtual Origin of Wave
T = Time from 10% to 90% of Peak
T
1
= Rise Time = 1.25 x T
T
2
= Decay Time
Example - For an 8/20
µs Current Waveform:
8µs = T
1
= Rise Time
20µs = T
2
= Decay Time
Figure 1
Figure 2