Soft dB Opus Suite Data Logger Module User Manual
Page 37
36
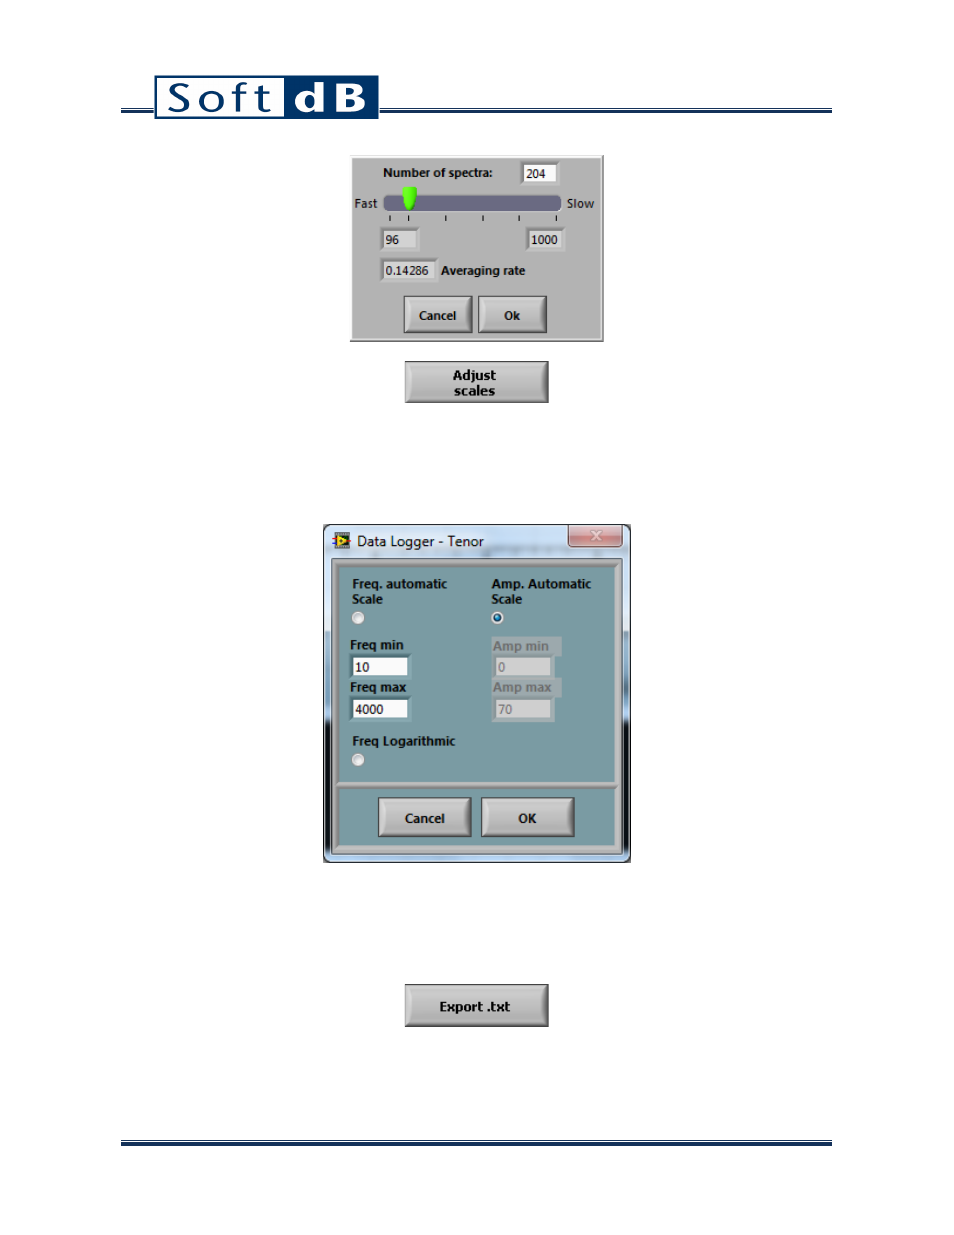
The Adjust scales button allows setting the frequency and amplitude scales of the waterfall graph.
Unlike on the other two-dimensional graphs of the interface, minimum and maximum scale values
cannot be changed directly on the waterfall graph. The minimum and maximum values for each scale
can be changed using the following dialog box:
The frequency and amplitude scales can be adjusted through the dialog box. The frequency scale can
also be put in logarithmic mapping mode. Note that no options are available for the time scale. The
waterfall graph is always generated for the entire framework. The starting point and the length of
the framework can be adjusted in the main interface (see section 10.3).
The Export .txt function allows exporting the waterfall data in a text format.