2 file info, 3 peak historic graph – Soft dB Opus Suite Data Logger Module User Manual
Page 25
24
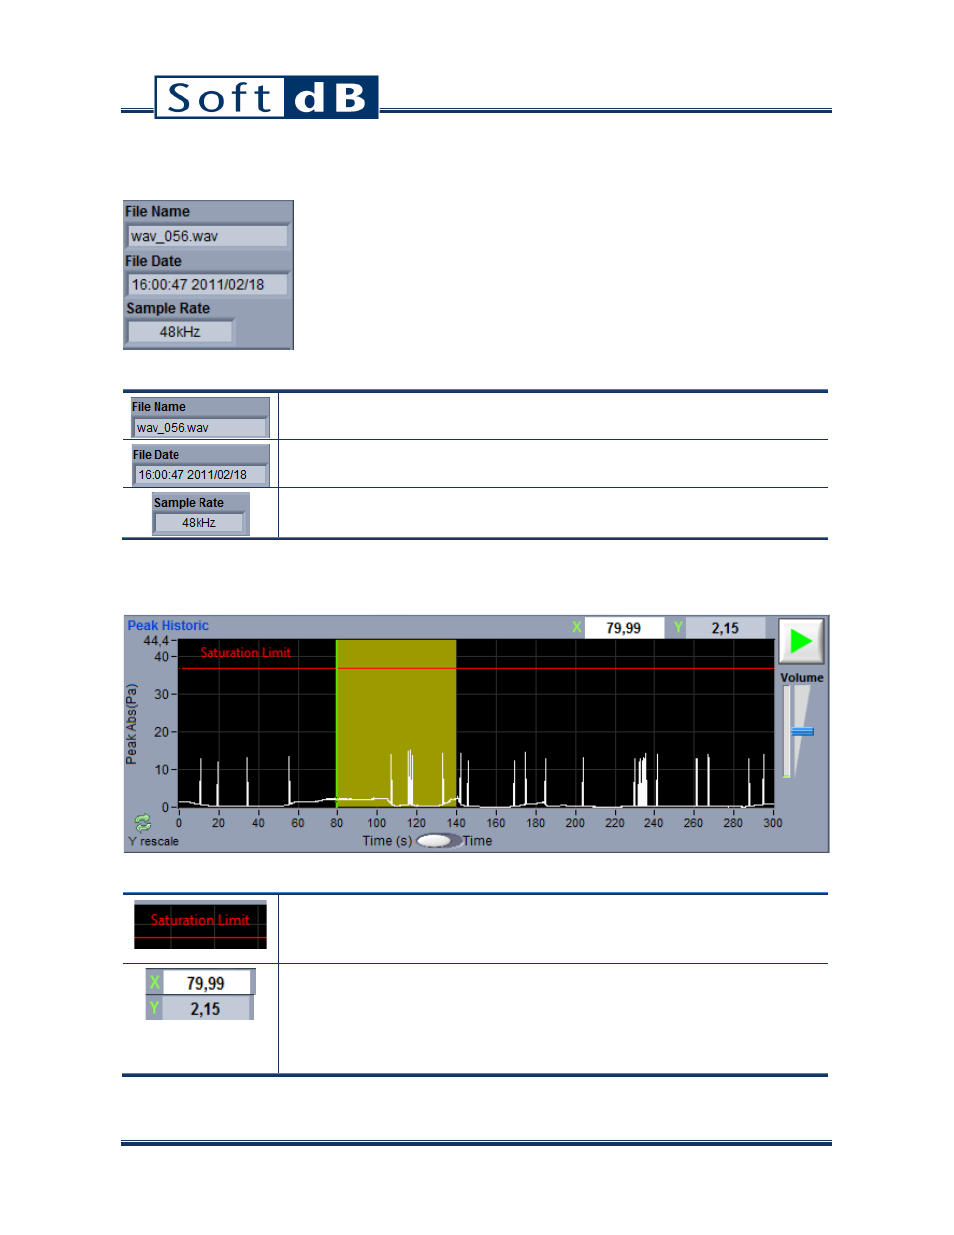
8.2 File Info
Input Info
File Name
This indicator displays the name of the file being viewed.
File Date
This indicator displays the starting time of the file being viewed.
Sample Rate
This indicator displays the sample rate of the file being viewed.
8.3 Peak Historic Graph
Peak Historic Graph
Saturation Limit
The red line at the top of the graph indicates the level of saturation of the
input.
Green cursor X and Y values
The green X (time) and Y (amplitude) values are linked to the green cursor on
the graph. The X value can be entered manually or defined by pointing to the
position on the graph. The cursor also defines the beginning to the yellow
area for the Time Signal Graph.