Sp1 sp2 sp3, Setpoint profiler 3 bar summary (spp_3bs) – Honeywell VRX180 User Manual
Page 220
Setpoint Profiler
Video Recorder – User Manual
206
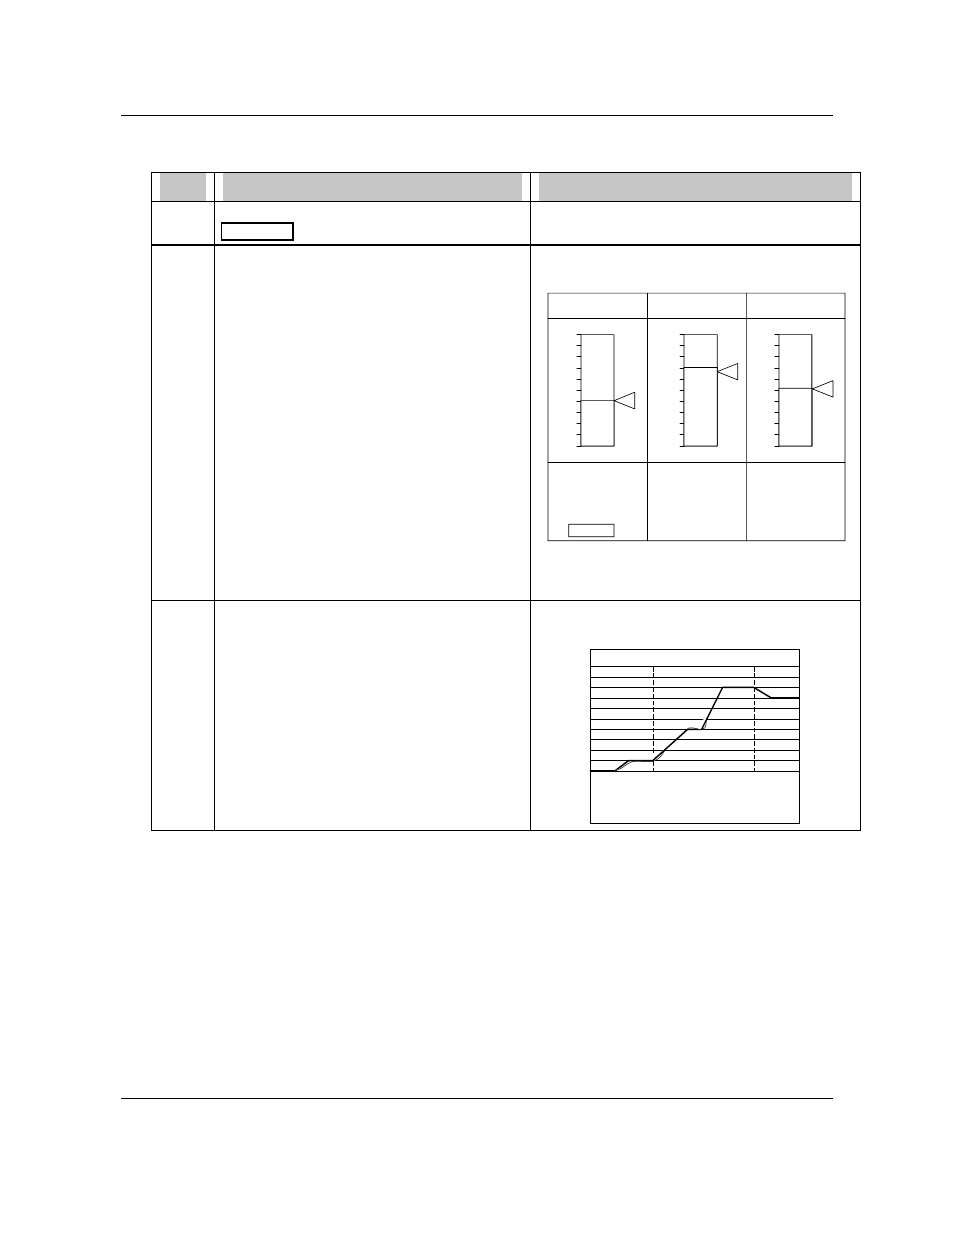
How to view profiler summary display
Table 5-20 Summary Viewing Procedure
Step
Action
Result/Notes
1
Perform steps 1 and 2 from Start procedure
(Table 5-13).
Profiler menu is displayed.
2
Press Decrement button to move cursor to
Summary. Press Enter.
Three profilers will be displayed as bar graphs.
Data for your profile(s) will be displayed.
RUN
40.00
SEG 5
00:21:13
TREND
READY
71.00
SEG 1
00:00:00
TREND
END
820.20
SEG 15
01:30:00
TREND
SP1
SP2
SP3
100.00
0.00
200.00
1500.00
-200.00
100.00
Setpoint Profiler 3 Bar Summary
(SPP_3BS)
3
Press the Tab button to move the cursor to the
TREND of the desired profiler, then press
Enter.
The profiler trend of the selected profile is
displayed.
SP1
PROFIL01
500.00
PV 241.27
SP 248.00
0.00
1:05:30
SEG6/9
RUN