Transfer function overlay list window, 72 4.32. sample transfer function – Metric Halo SpectraFoo User Manual
Page 72
The Transfer Function
72
Click the Invert Trace checkbox and then the OK button. The Overlay List window will appear (the list
in this figure has a number of overlays; yours will have just the new one):
Figure 4.31: Transfer function Overlay List window
You now have a complete measurement of the transfer function of your system. You may want to make a
number of measurements for further averaging, but what we have now is good enough to illustrate the cor-
rection process.
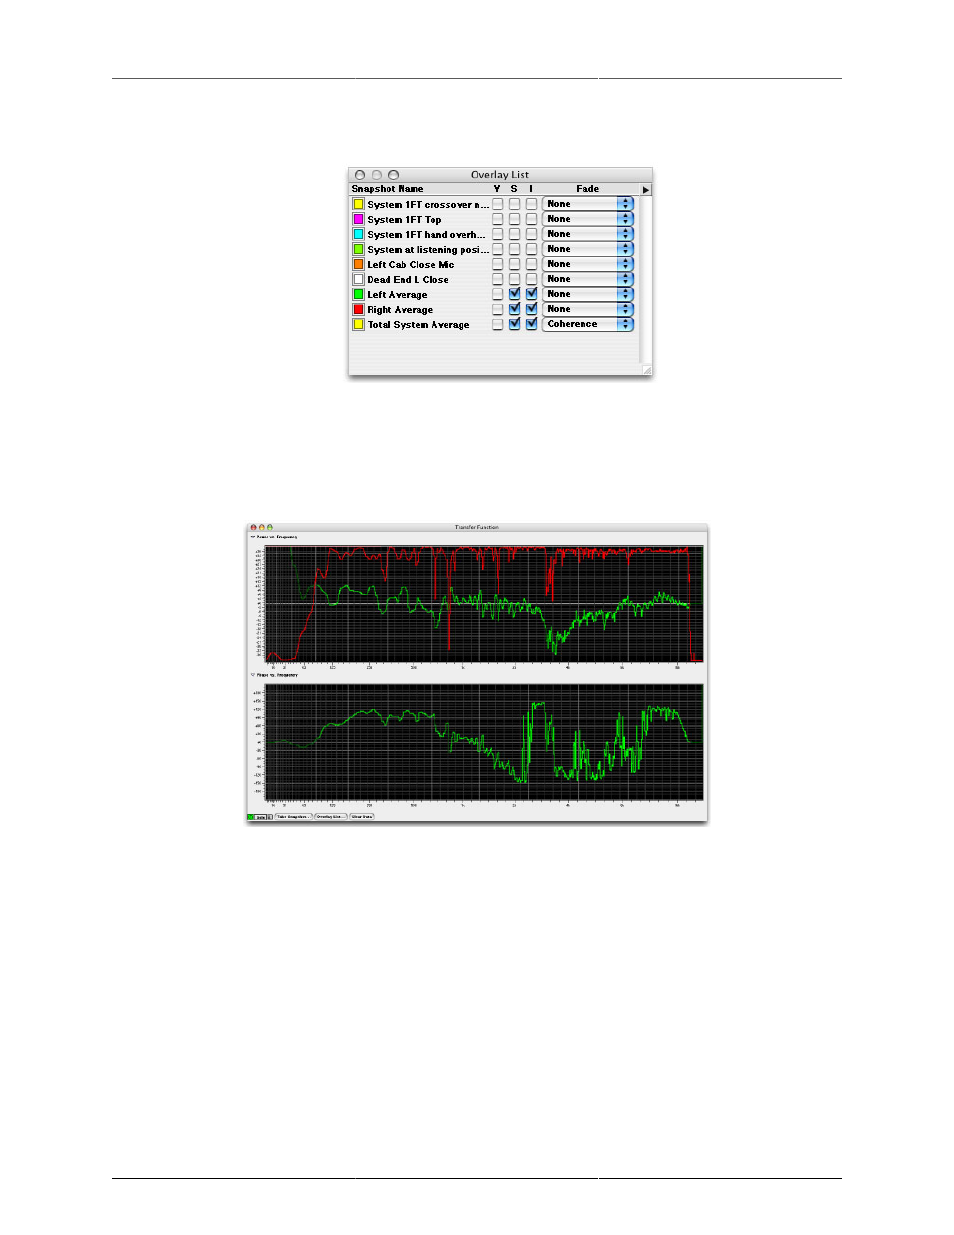
Here is an example of a measurement that we have made using the procedure described above:
Figure 4.32: Sample transfer function
We see that the coherence is reasonably high (with a few narrow exceptions) from about 80 Hz to 18 kHz.
Below 80 Hz, the sound system is not really reproducing the test signal and the environmental noise is pretty
high. In addition, the test signal does not have a tremendous amount of energy below 60Hz. The test signal did
not have much energy above 18 kHz, so we have not really measured the system response from that point on.
There are a few significant dips in the system response. Some of these are quite narrow and correspond to
significant dips in the coherence curve. These dips are most likely caused by measurement nulls due to acoustic
reflections and must be ignored since the coherence is so low.
Some of the dips in the response correspond to places where the coherence is high. These dips are real and
can be corrected with EQ.
Notice that there are a series of closely spaced notches in the high end of the system response (8 kHz and
up). These correspond to reflection nulls that will move around when the microphone position is changed, but