Understanding the transfer function, Clear data, 62 4.14. power panel – Metric Halo SpectraFoo User Manual
Page 62: 62 4.15. phase panel
The Transfer Function
62
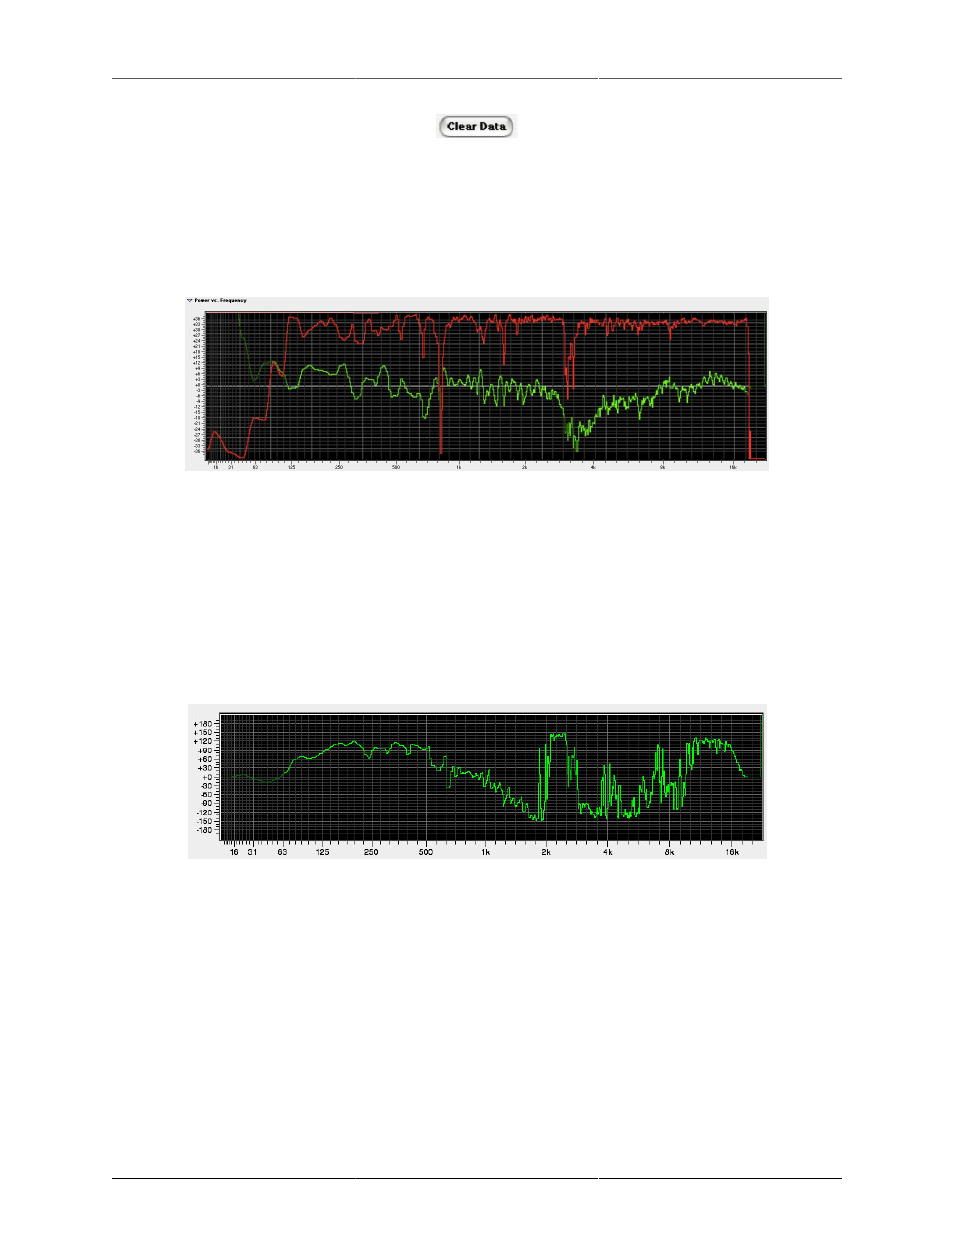
Figure 4.13: Clear Data
Clicking on Clear Data clears the current transfer function data and resets the transfer function to flat. This
is useful when you start measuring a new system or device or move a test microphone and you want to start
the measurement from scratch.
The Transfer Function data is displayed in two different panels:
Figure 4.14: Power Panel
The power panel displays the relative power between the response signal and the source signal as a function
of frequency. The relative power curve is drawn in green. The vertical calibration is in units of dBr (decibels
relative). The horizontal calibration is in units of frequency (Hz). The limits of both the vertical and horizontal
scales are controlled with the Transfer Function control window.
The power panel also displays the coherence of the measurement as a function of frequency. The coherence
curve is displayed in red. The vertical scale of the coherence is linearly scaled. The vertical limits of the
coherence (which are not displayed) are “0” at the bottom of the graph and “1” at the top of the graph. These
limits do not change when you change the power limits.
Figure 4.15: Phase Panel
The phase panel shows the relative phase between the response and source signals. The vertical scale of the
phase panel is linear and is in units of degrees. Since phase is cyclic (that is, if the phase of a signal is x then x
+360° is the same phase), the phase curve can wrap around from 180° to -180°. You can see this in the graph
above at f = 2kHz. The phase does not really have a discontinuity at 2kHz, it has just wrapped around to
+180°. The horizontal calibration is in units of frequency (Hz). The limits of the horizontal scale are controlled
with the transfer function control window.
Understanding the Transfer Function
The purpose of the transfer function measurement is to allow you to find out what a particular electro-acoustical
system is doing to the signal it is processing. We call the system being measured the System Under Test (SUT –
also called DUT in other literature). The SUT could be as simple as an equalizer or as complex as a multi-zone