Guralp Systems CMG-5T Compact User Manual
Page 15
Operator's Guide
Calibration Line for all three components. Other choices will
not have a useful effect.
3. Make any other choices you require and click Inject now. A
new data stream, ending Cn (n = 0 – 7) or MB, should appear in
Scream!'s main window containing the returned calibration
signal.
4. Open a Waveview window on the calibration signal and the
returned streams by selecting them and double-clicking. The
streams should display the calibration signal combined with the
sensors' own measurements. If you cannot see the calibration
signal, zoom into the Waveview using the scaling icons at the
top left of the window or the cursor keys.
5. If you need to scale some of the traces individually, right-click
on each desired trace and select Scale.... You can then type in a
suitable scale factor for that trace.
6. Click on Ampl Cursors in the top right hand corner of the
window. A white square will appear inside the Waveview at the
top left. This is in fact two superimposed cursors.
7. Drag one cursor down to be level with the lowest point of the
signal trace.
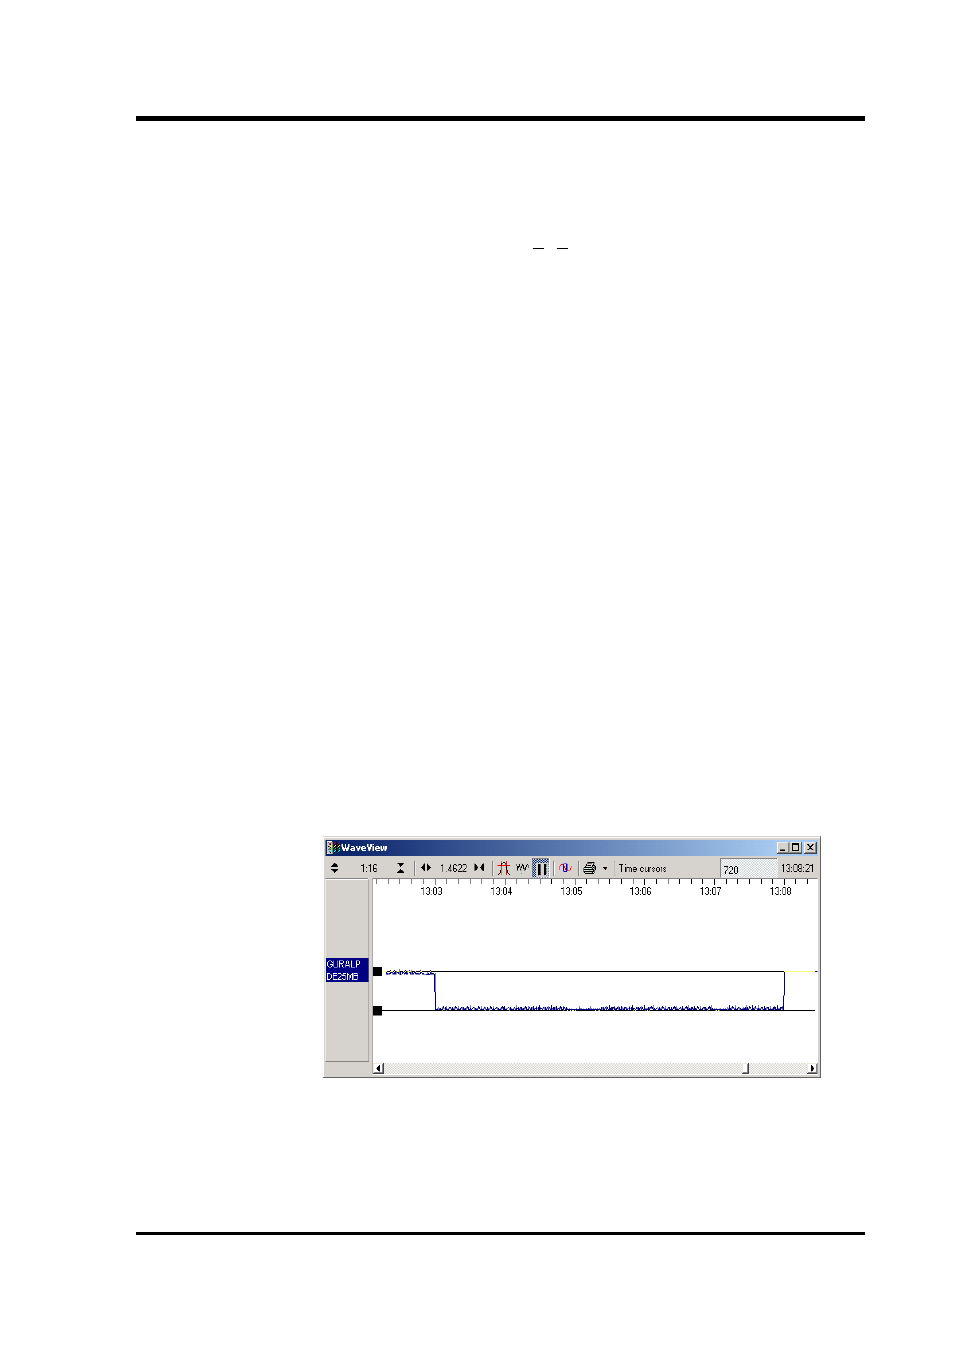
8. Drag the other down to be level with the highest point. In the
following example, a step function of 1 minute duration has
been applied to the Z3 stream. Note that ground movements
continue to be observed, superimposed on the returned
calibration signal.
The Ampl Cursors button will now be displaying a value, which
is the strength of the returned signal in counts (doubled, if using
a sine wave). Measure the other two signal strengths in the
same manner.
May 2011
15