Xtramus NuTEA-551 V1.2 User Manual
Page 28

28
Report
When choosing Chart from the Menu Bar, a Chart Window will pop up and display
system statistics in the form of graphic charts. Two different charts are available here: Line,
and Bar.
¾
Line: Displays statistics including Rx/Tx Utilization, Rx/Tx Line Rate, and Rx/Tx
Packet Rate.
¾
Bar: Displays statistics including Packet CRC Error, Packet Corrupt, Packet
Drop, Packet Reorder, and Packet Duplicate.
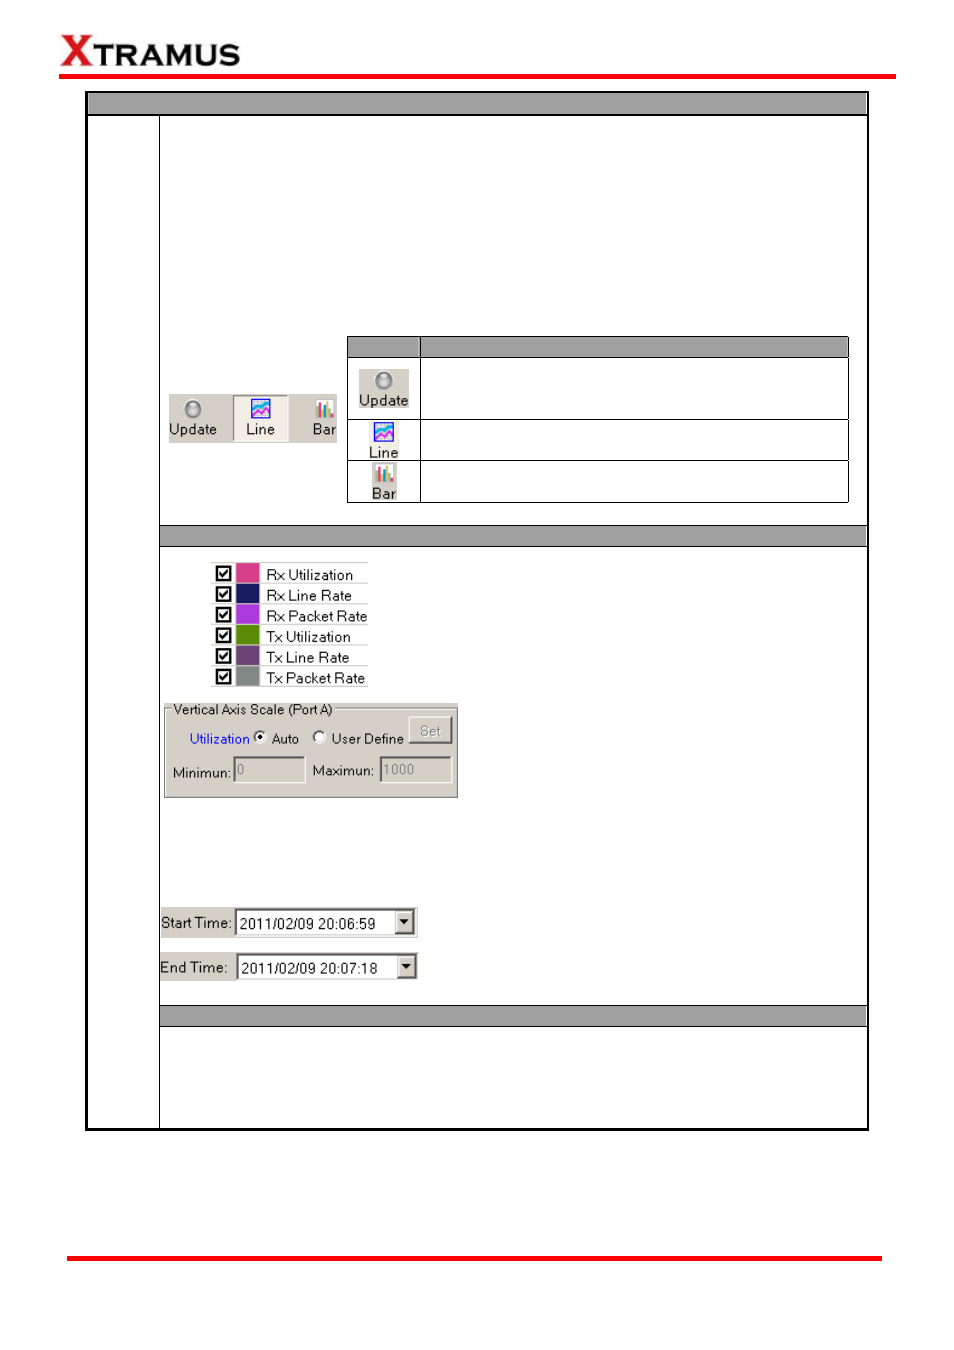
You can adjust the chart the Control Buttons located on the upper part of the Chart
Window.
Button
Description
Click the Click button allows the Chart Window to start
updating the chart dynamically. Click the Click button
again will stop updating.
Click the Line button allows the Chart window to
display the chart in Line mode.
Click the Bar button allows the Chart window to
display the chart in Bar mode.
Also, you can adjust how charts are displayed in the Chart Window:
Line
You can set the information you would like to display/hide
on the Chart Window. Click the check box in front of the
information you would like to display/hide here.
As mentioned above, under Line mode, the Chart
Window displays statistics including Rx/Tx Utilization,
Rx/Tx Line Rate, and Rx/Tx Packet Rate. All of them
are represented by lines in different colors.
You can set chart’s Y-Axis (Vertical Axis) display
scale for Port A, Port B, or both Port A & B here.
Two different modes of scale can be selected here:
Auto, and User Define.
¾
Auto: The Chart Window will adjust the display range of Y-Axis automatically.
¾
User Define: You can set the display range of Y-Axis by yourself. Input the
minimum and maximum range for the Y-Axis in the corresponding fields, and click
the Set button to apply the settings you’ve made.
The Time Scale allows you to view charts in a specific
period of time. Click the Start Time scroll-down menu to
choose the starting time, and click the End Time
scroll-down menu to choose the ending time. All statistics
between Start Time and End Time will be displayed in
the chart.
Bar
Chart
As mentioned above, under Bar mode, the Chart Window displays statistics including
Packet CRC Error, Packet Corrupt, Packet Drop, Packet Reorder, and Packet
Duplicate. All of them are represented by bars in different colors.
You can only adjust the Time Scale under Bar mode.
E-mail: [email protected]
Website: www.Xtramus.com
XTRAMUS TECHNOLOGIES
®
