CIRCUTOR AR5L Series User Manual
Page 21
21
5.- DATA VISUALIZATION ON DISPLAY
All measured instantaneous values, as well as maximum and minimum, can
be read on a 160 x 160 pixel, liquid, crystal display (back-light ability).
An indication of the type of data being displayed is shown at the upper right
corner.
5.1.- Base screen
5.1.1.- Screen of instantaneous values
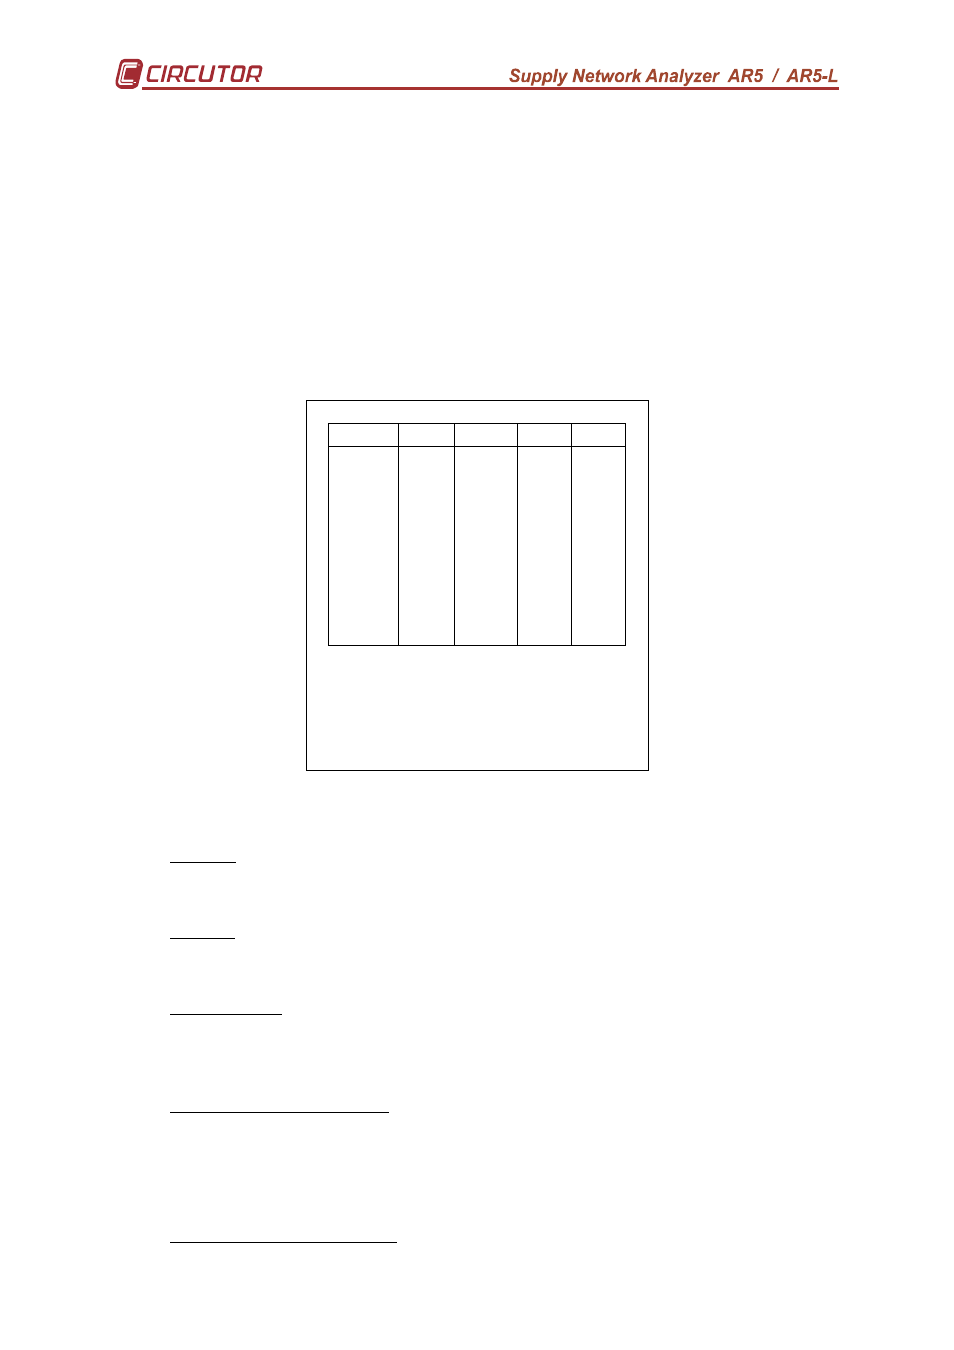
When powering the analyzer on, the display will show:
HARMONICS
INST
L1
L2
L3
III
Vp-n
A
kW
kvarL
kvarC
P.F.
Hz
kVA
A
N
220
221
223 221
kWh 0.000
kvarLh 0.000
kvarCh 0.000
25 / 10 / 04 17 : 31 : 29
Instantaneous value screen
Voltage: Readout of the instantaneous RMS value measured at each phase
(L1, L2 & L3) and the average value of the instantaneous values of the three phases
(III).
Current : Readout of the instantaneous RMS value measured at each phase
(L1, L2 & L3) and the average value of the instantaneous values of the three phases
(III).
Active power: The active power is calculated from instantaneous voltage and
current data. The readout gives the instantaneous values of the active power of each
phase and also the three phase total instantaneous active power, which is the
addition of each phase value.
Inductive reactive power: The inductive reactive power is calculated from
instantaneous voltage and current data. The readout gives the instantaneous values
of the inductive reactive power of each phase and also the three phase total
instantaneous inductive reactive power, which is the addition of each phase value.
Capacitive reactive power: The capacitive reactive power is calculated from
instantaneous voltage and current data. The readout gives the instantaneous values