Casella CEL Software for Nomad (Standard Operation) User Manual
Page 30
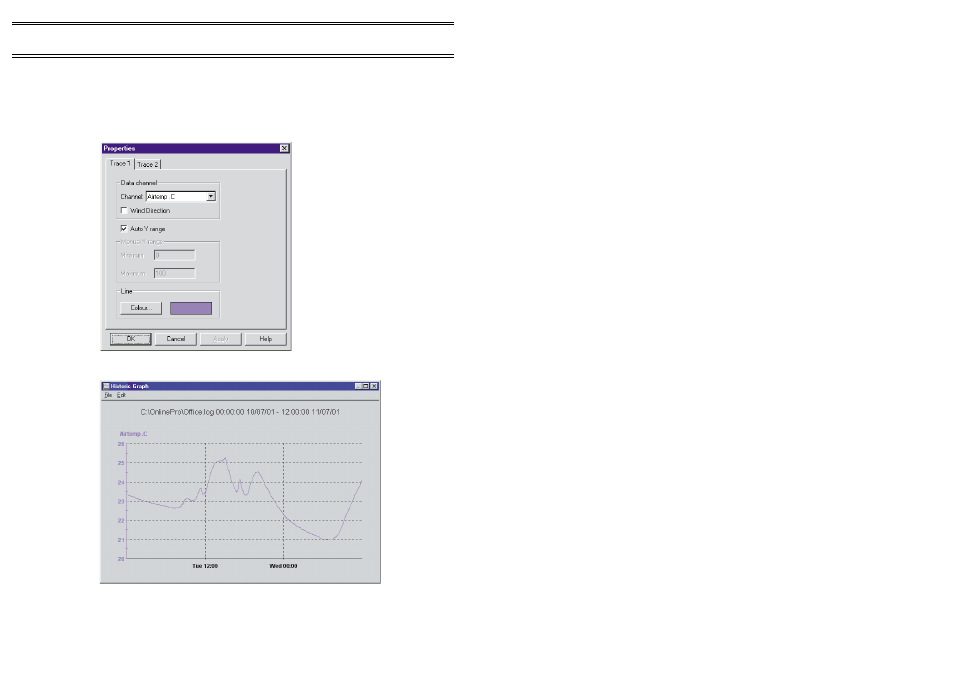
When the graph is plotted from Logged data, the software selects
the only stored file from the selected monitor system that covers the
specified time range, then displays the
Properties
dialog. When Downloaded
data is used, the Browse... button enables you to select the required file, then
the software displays the
Properties
dialog. This allows you to specify up to
two channels for display as separate line graphs plotted against time.
The trace colours can be specified, and the Y scale can be
manually set or auto ranged.
Historic Windrose
This also displays the
Historic Data Range
dialog which allows you to select
the time and date period you wish to be displayed on the windrose.
Historic Data
ONLINE Pro Application Software for
Automatic Monitor Systems - Users Handbook
Page 30 of 68