Changing the vertical scale, Isplaying a data table – Casella CEL Microdust 880 IS real time dust monitor User Manual
Page 30
Microdust 880nm & WinDust Application Software
Handbook HB3255-03
Page 30 of 51
The graph will automatically redraw using all the data in the file.
The x-axis will be marked in hours if the total selected period is less than a single day otherwise it
will be marked in days.
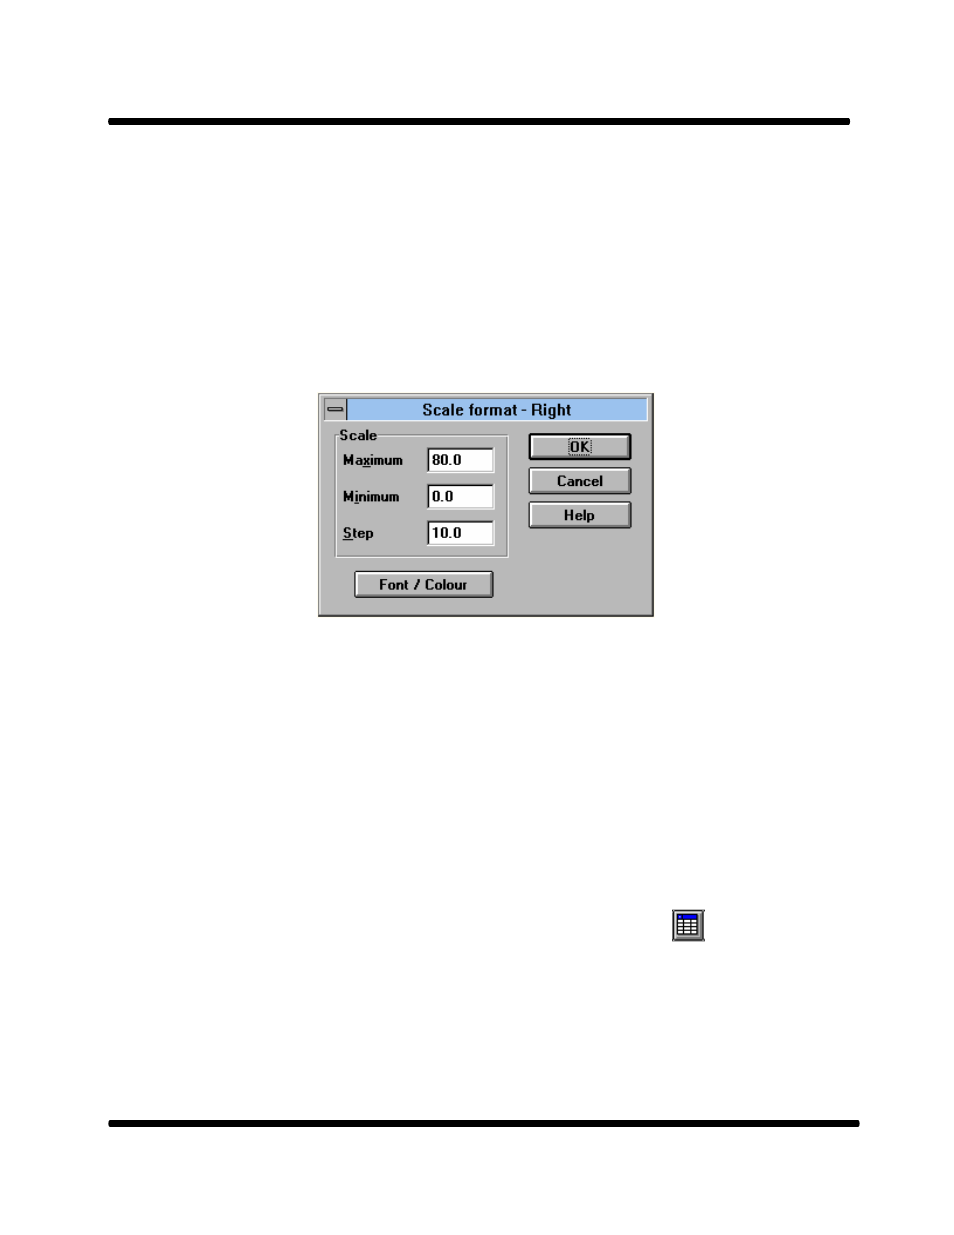
Changing the vertical scale
The maximum and minimum Y axis values can be adjusted to suit the range of values displayed on
the graph. To alter the range of a graph, double click in the text area to the left of the vertical axis.
In the displayed dialogue box enter new values for the ‘Maximum’, ‘Minimum’ and ‘Step’ settings.
The font used to display the vertical scale for the trace together with the colour used to draw the trace
can be modified by clicking the ‘Font / Colour’ button.
Displaying a data table
Displaying the data file information as a table allows you to see the actual values recorded by the
Microdust together with the date & time of their occurrence. The table option displays only that
portion of the data file currently displayed in the graph. This allows large data files to be handled
more efficiently by only extracting the period of interest.
To display a table, select Report | Show table from the menu or click the
icon.