Extracting data from the logger, Isplaying a graph – Casella CEL Microdust 880 IS real time dust monitor User Manual
Page 28
Microdust 880nm & WinDust Application Software
Handbook HB3255-03
Page 28 of 51
The menu window shown above is used to display a recorded concentration value together with the
date and time of occurrence. The first record displayed will correspond to the last logged record.
Pressing the ‘Enter’ key steps backwards through all recorded data points. The window will not be
displayed if the logger memory is empty.
Extracting data from the Logger
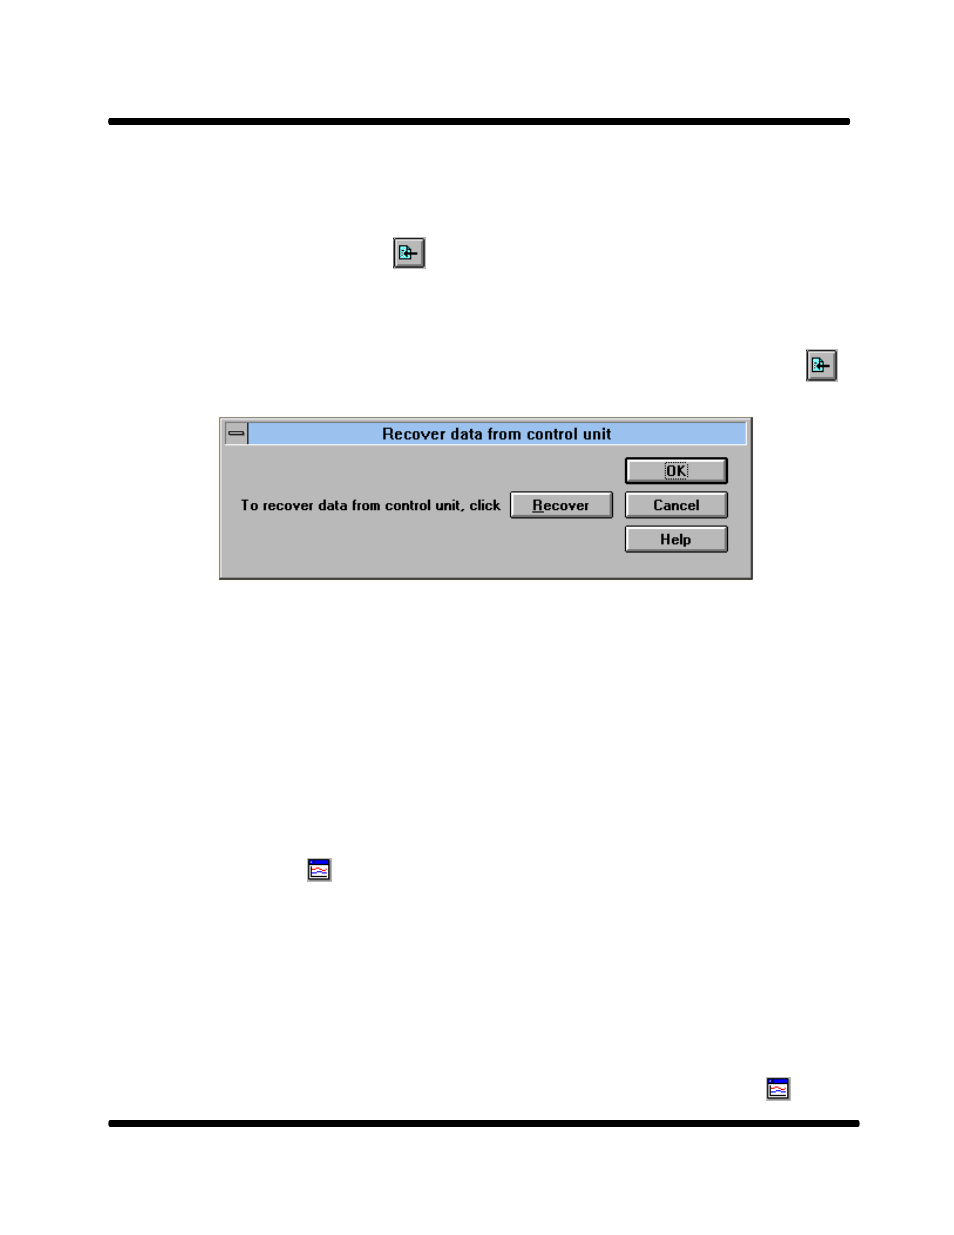
Before you can generate graphs and tables of the data recorded by the Microdust you must transfer it
onto your computer.
To download data, select the Logger
Recover data... option from the menu or click on
the icon.
Before attempting to download data from the Microdust ensure that;-
•
The Microdust is switched on.
•
The serial communications cable is plugged into both the Microdust and a free serial port on
your computer.
Pressing the ‘Recover’ button will start the download sequence. Data representing individual sample
runs will be saved into separate files with each file being allocated a unique index number.
Displaying a graph
Having successfully recorded and transferred data to your computer you are now in a position to
view it. The first method available is to view data on a graph. The graph display forms the basis of all
analysis displays available within the WinDust software.
Both table and summary displays are based on the information shown by the current graph, this
enables tables and summaries to be created from a subset of the data contained in any given file (i.e.
select a single days worth of data from a file covering several days).
To display a graph, select the Report | Show graph option from the menu or click the