Parr Instrument 4857 User Manual
Page 29
4857 Reactor Controllers
- 29 -
D
ATA
L
OGGING
(
CONTINUED
)
Creating a Chart (continued)
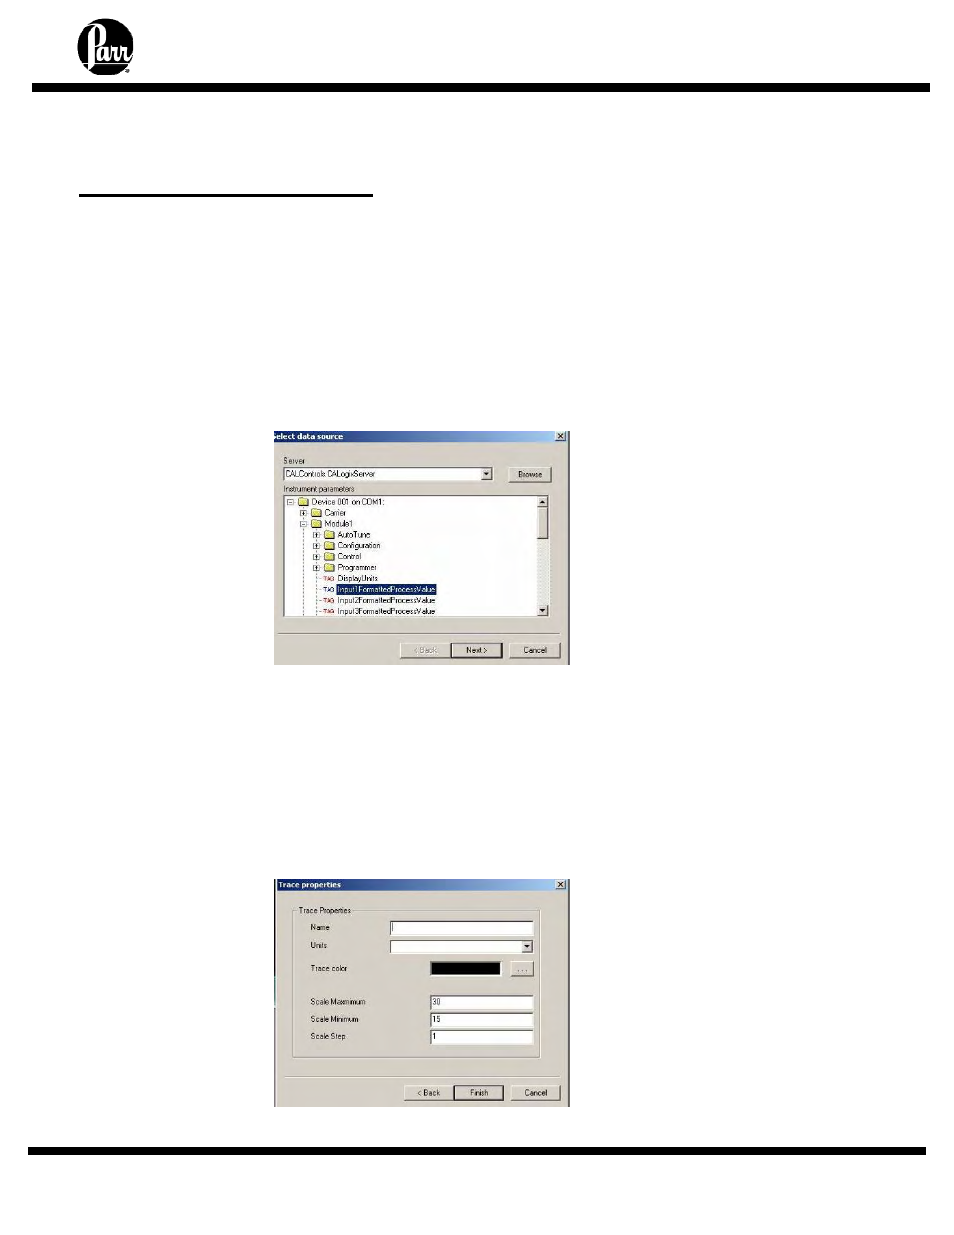
4. This opens the Select Data Source dialog. First select “CalControls.CALogixServer” from
the Server pull down list. Then select a data source tag from the tree in the instrument list to
add to the chart. The default name for the temperature read from the control thermocouple
is:
“Module 1 >> tag-Input1FormattedProcessValue”
The pressure tag would be located under
"Module 2 >> tag-Input1FormattedProcessValue"
and the RPM tag would be
"Module 3 >> tag-Input1FormattedProcessValue."
5. This should bring you to the Trace Properties dialog. Enter the required name and scales for
this trace (or use default values) and press Finish.