Data logging – Parr Instrument 4857 User Manual
Page 28
4857 Reactor Controllers
- 28 -
D
ATA
L
OGGING
Creating a Chart
Data logging is most easily accomplished by creating a chart to plot the values you wish to log,
and then exporting the chart data as a .CSV file. CSV files can be opened directly by most data
analysis type programs, including Microsoft Excel.
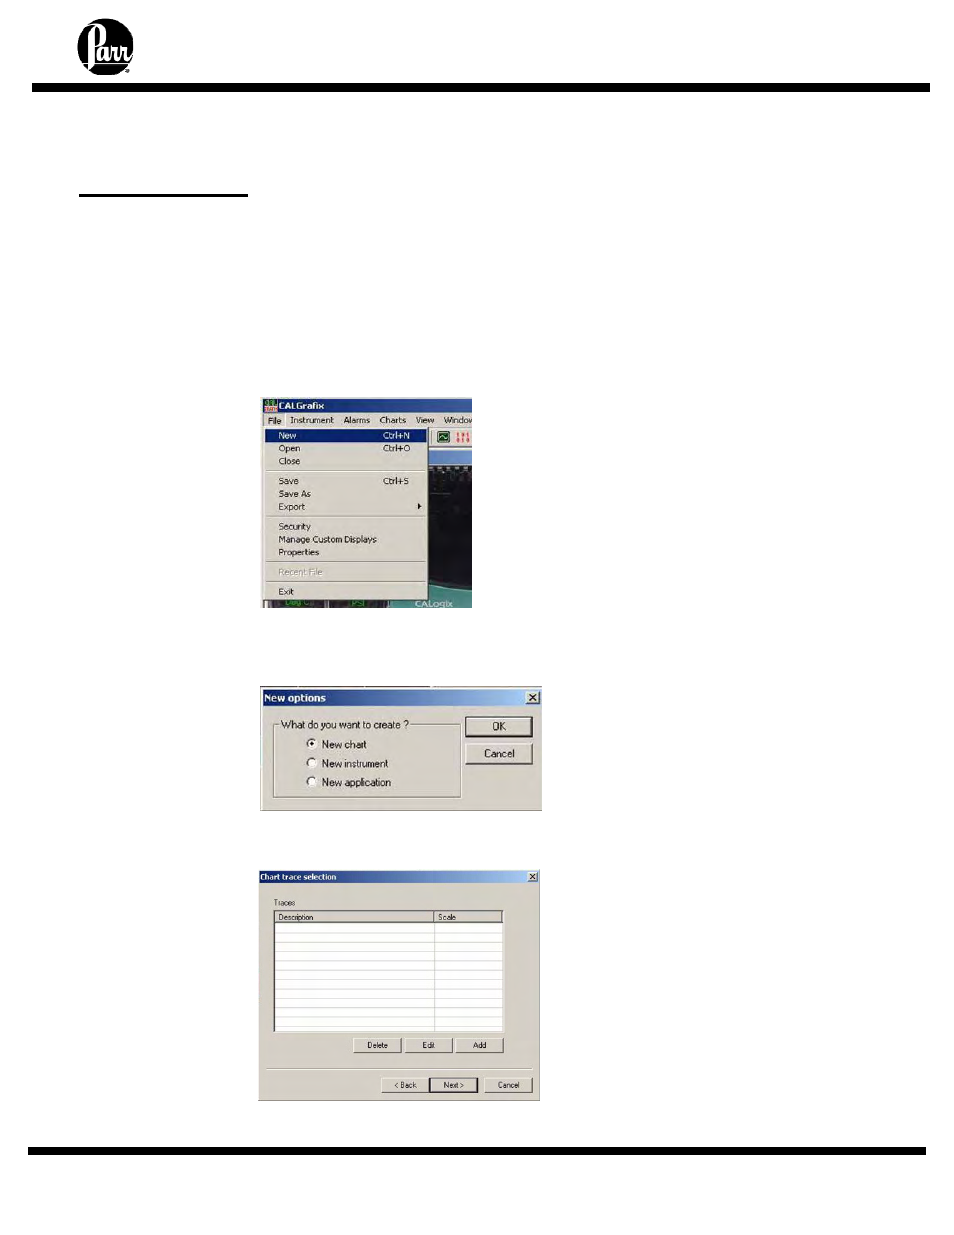
1. Select the
OK. Alternatively, you may press the [New Chart] button on the toolbar.
2. This opens the Chart Properties dialog. First, enter the required title for the new chart. Then
select any changed chart options and press Next.
3. This opens the Chart Trace Selection dialog. Press the Add button to add a new trace to the
chart.