9 measured result graph, 1 viewing graph, 2 saving image – Rice Lake Upper Body Single Frequency Composition Analyzer - D1000-2 - Pass Plus Software User Manual
Page 34: 3 print, 4 close
30
Body Pass Plus Software Program
2.9
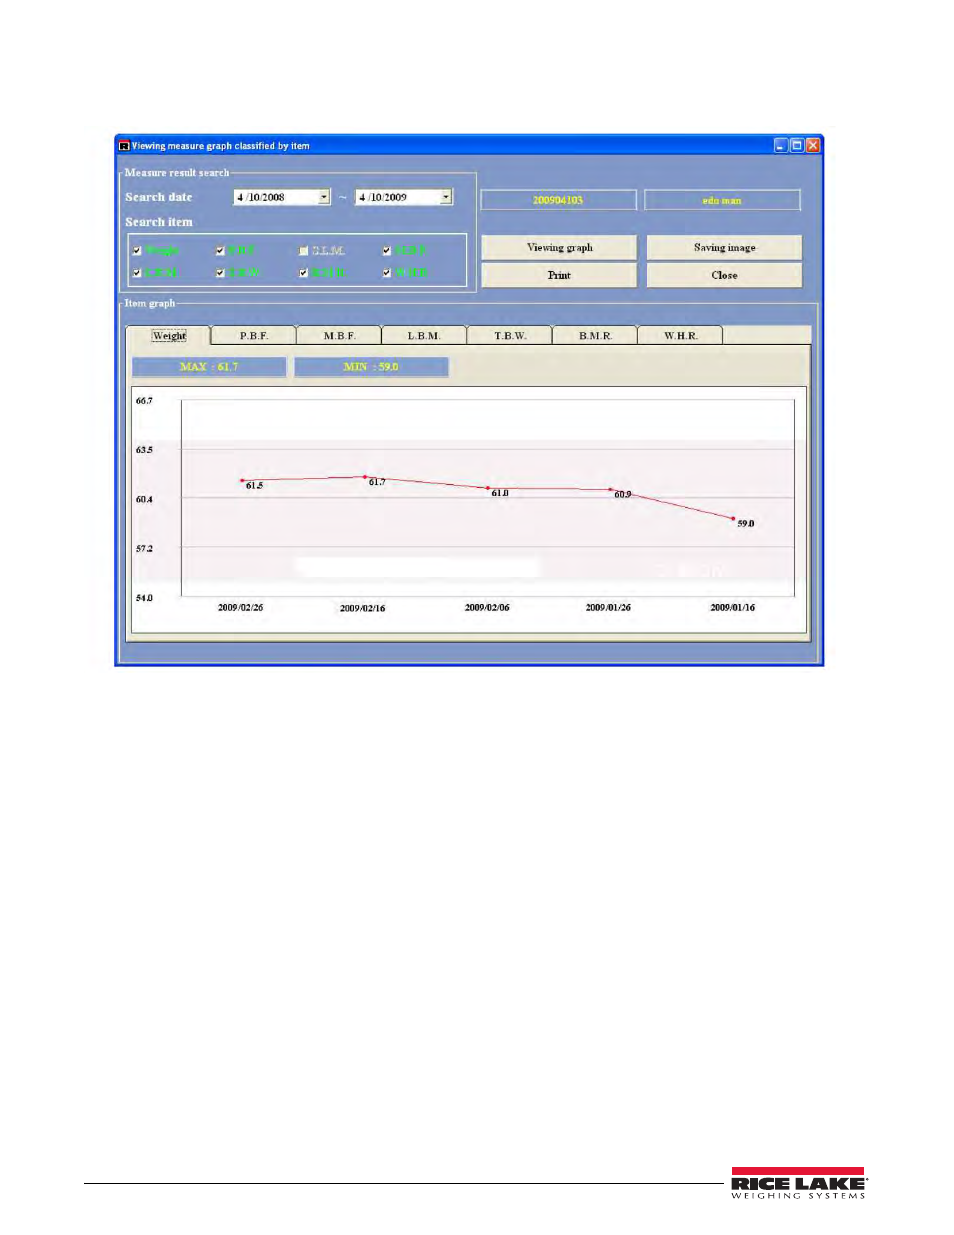
Measured Result Graph
Click on the
Measured Graph
button from the main menu to access the graph for a specific member.
There are four tabs which can be accessed for a member’s information. They are listed below.
2.9.1
Viewing Graph
Press the
Viewing Graph
button to select measurement items and dates of a particular member. A graph is shown that
is divided according to the selected items by means of a tab. Pressing each tab displays the corresponding graph.
When the graph is completely drawn, the
and
Save Images
buttons are activated. Right above the graph
marked are the maximum and minimum values with the items under search over a given period.
Choosing other items in this same level, inactivates the buttons
and
Save Images
. You must click the
Viewing
Graph
button again to view a new graph containing additional items and the
and
Save Images
buttons are ready.
In case the measurement data pieces are 10 or less, the related dates are all presented. Otherwise the dates are
displayed on a weekly basis.
2.9.2
Saving Image
Pressing the
Saving Image
button enables saving the graph as an image file. After pressing the button and selecting
the location to save it to, save the graphs with BMP file extensions for each item chosen to be printed out. Graphs
are included in one image and when the entire seven items are selected, a total of three images are saved.
For the file name, First - Second - Third is automatically attached to the head of each name of files to be saved.
2.9.3
Upon pressing the
button, a messages appears,
Do you want to print out the selected items?
Selecting the OK
button will print a page with three graphs on it. The contents printed are the same as the saved.
2.9.4
Close
Press the
Close
button to exit out of the graphs screen and proceed back to the main menu.