Mercedes-Benz S-Class 2008 COMAND Manual User Manual
Page 603
602
Operation
Tires and wheels
In addition to tire load rating, special load
identification
1 may be molded into the
tire sidewall following the letter designat-
ing the tire speed rating
6 (
୴
page 598).
No specification given: absence of any text
(like in above example) indicates a
standard load (SL) tire.
XL (Extra Load): designates an extra load
(or reinforced) tire.
Light Load: designates a light load tire.
C, D, E: designates load range associated
with the maximum load a tire can carry at
a specified pressure.
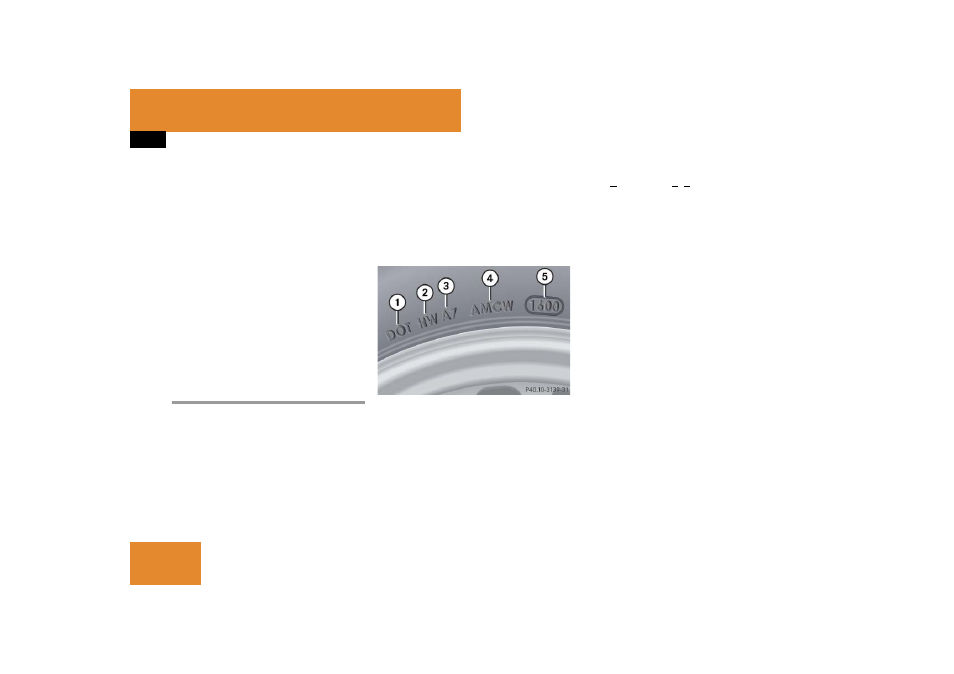
DOT, Tire Identification Number (TIN)
U.S. tire regulations require each new tire
manufacturer or tire retreader to mold a
TIN into or onto a sidewall of each tire
produced.
The TIN is a unique identifier which facili-
tates efforts by tire manufactures to notify
purchasers in recall situations or other
safety matters concerning tires and gives
purchasers the means to easily identify
such tires.
The TIN is comprised of “Manufacturer’s
identification mark”, “Tire size”, “Tire type
code” and “Date of manufacture”.
1 DOT
2 Manufacturer’s identification mark
3 Tire size
4 Tire type code (at the option of the tire
manufacturer)
5 Date of manufacture
DOT (Department of Transportation)
A tire branding symbol
1 (
୴
page 602)
which denotes the tire meets require-
ments of the U.S. Department of Transpor-
tation.
Manufacturer’s identification mark
The manufacturer’s identification mark
2
(
୴
page 602) denotes the tire
manufacturer.
New tires have a mark with two symbols.
Retreaded tires have a mark with four sym-
bols. For more information on retreaded
tires (
୴
page 582).
Tire size
The code
3 (
୴
page 602) indicates the
tire size.
Tire type code
The code
4 (
୴
page 602) may, at the
option of the manufacturer, be used as a
descriptive code for identifying significant
characteristics of the tire.
i
For illustration purposes only. Actual data
on tires are specific to each vehicle and may vary
from data shown in above illustration.