Help menu, Probe interaction screen – ETS-Lindgren HI-6113 Laser Data Interface and Probe Measurement System User Manual
Page 32
32
|
ProbeView Laser Software
H
ELP
M
ENU
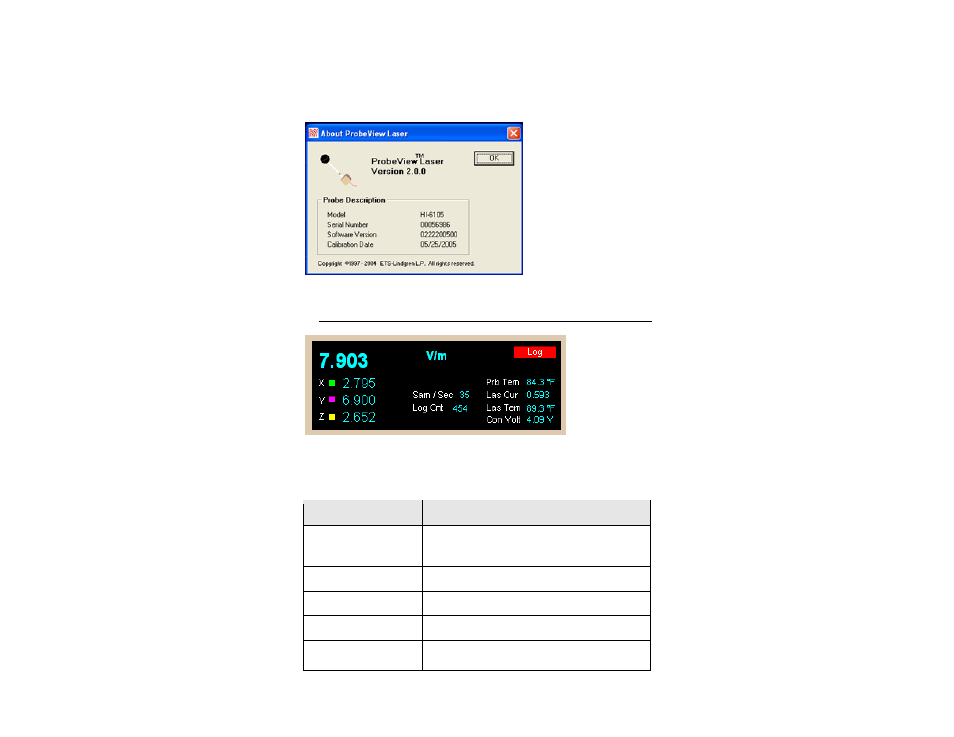
Help About: Provides information about the software revision and probe in use.
Probe Interaction Screen
These areas may be displayed in the ProbeView Laser main screen:
Moving Average, Bar Graph and Scatter Graph. The Peak screen and
Probe Status screen are always active.
Probe Status Screen
Description
Field
Combined value of the X, Y, and Z axes. This
value is the square root of the sum of the squares
when working with linear units.
X
Value from X-axis reading.
Y
Value from Y-axis reading.
Z
Value from Z-axis reading.
Units
Units of field strength or power density. Right-click
this label to scroll through available units.
See also other documents in the category ETS-Lindgren Equipment:
- SMART 200 Reverb Chambers (45 pages)
- 6402 Helmholtz Coil (24 pages)
- 3625-2 LISN (15 pages)
- 3701 Line Probe (15 pages)
- 3725-2M LISN (19 pages)
- 3810-2 LISN (25 pages)
- 3816-2 LISN (21 pages)
- 3850-2 LISN (19 pages)
- 4825-2 LISN (25 pages)
- 1052 Antenna Tower Positioner (23 pages)
- 2005 Single Axis Positioner (32 pages)
- 2090 Controller (178 pages)
- 2110 Multi-Axis Positioning Systems (MAPS) (48 pages)
- 2115 Multi-Axis Positioning Systems (MAPS) (48 pages)
- 2165 Turntable (46 pages)
- 2171B Boresight Antenna Tower (64 pages)
- 2175 Antenna Tower (41 pages)
- 2181 Turntable (44 pages)
- 2187 Turntable (36 pages)
- 2188 Turntable (39 pages)
- 7-TR Tripod Positioner (49 pages)
- 7000-001 EMCenter Modular RF Platform (41 pages)
- 7405 E & H Near Field Probe Set (51 pages)
- 91197-1 Current Probe (57 pages)
- 95236-1 Current Probe (27 pages)
- HI-1501 Microwave Oven Survey Meter (28 pages)
- HI-1600 Microwave Oven Survey Meter (26 pages)
- HI-1710A Microwave Oven Survey Meter (57 pages)
- HI-1801 Microwave Oven Survey Meter (24 pages)
- HI-2200 RF Survey Meter (53 pages)
- HI-2602 Interlock Monitor (22 pages)
- HI-2790B Calibration Comparison System (44 pages)
- HI-3603 VLF Survey Meter (55 pages)
- HI-3604 ELF Survey Meter (44 pages)
- HI-3624(A) Survey Meter (22 pages)
- HI-3627 ELF Magnetic Field Meter (36 pages)
- HI-3637 VLF Magnetic Field Meter (48 pages)
- HI-3638 ELV/VLF Electric Field Meter (41 pages)
- HI-3702 Induced Current Meter (34 pages)
- HI-3804 RF Industrial Compliance Meter (25 pages)
- HI-4416 Numeric EMF Readout Unit (38 pages)
- HI-4433-CH Magnetic Field Probe (42 pages)
- HI-6005 Electric Field Probe (152 pages)
- HI-6100 Field Monitor (71 pages)