ETS-Lindgren HI-6113 Laser Data Interface and Probe Measurement System User Manual
Page 28
28
|
ProbeView Laser Software
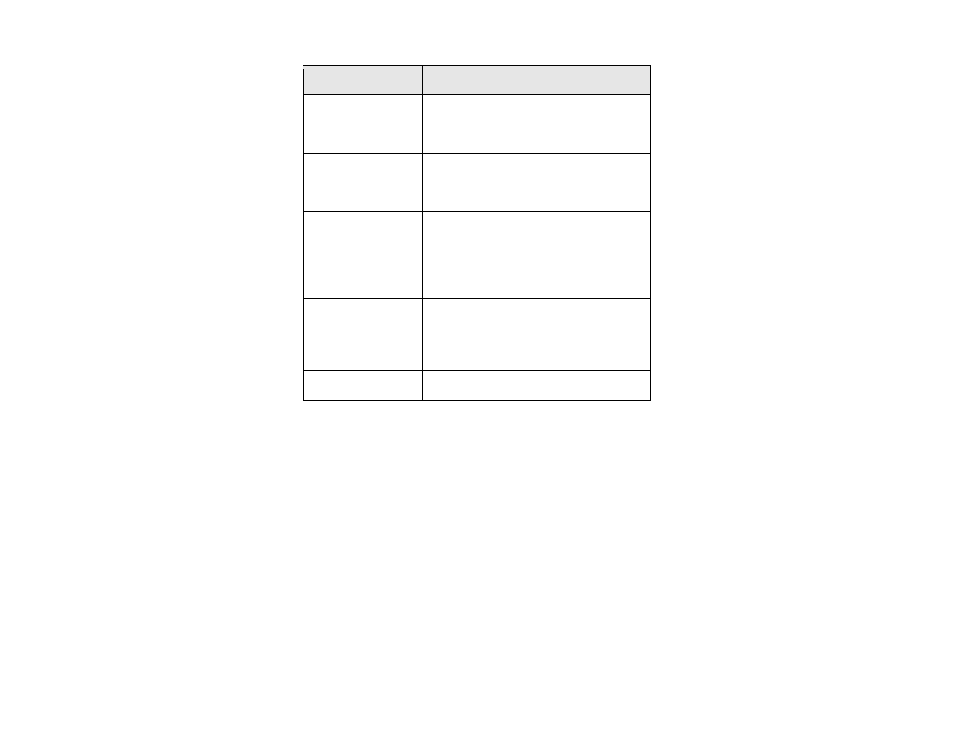
View Menu
Description
Bar Graph
Displays the field intensity or power density for
each axis and the combined field intensity of the
X, Y, and Z axes.
Scatter Graph
Displays the data in graph form. Live probe data
will not be plotted unless Scatter Graph Live is
enabled.
Scatter Graph Live
After probe data is logged it may be viewed in
the graph. Live probe samples are not plotted
while viewing previously logged data. This
function toggles back to view live probe data.
Data is not saved unless logging is turned on.
Header Notes
Displays information about previously logged
data that was saved and then reloaded into
ProbeView Laser. The Header Notes are saved
with the data when it is exported to a csv file.
Options
Sets screen colors, averaging, and so on.
- SMART 200 Reverb Chambers (45 pages)
- 6402 Helmholtz Coil (24 pages)
- 3625-2 LISN (15 pages)
- 3701 Line Probe (15 pages)
- 3725-2M LISN (19 pages)
- 3810-2 LISN (25 pages)
- 3816-2 LISN (21 pages)
- 3850-2 LISN (19 pages)
- 4825-2 LISN (25 pages)
- 1052 Antenna Tower Positioner (23 pages)
- 2005 Single Axis Positioner (32 pages)
- 2090 Controller (178 pages)
- 2110 Multi-Axis Positioning Systems (MAPS) (48 pages)
- 2115 Multi-Axis Positioning Systems (MAPS) (48 pages)
- 2165 Turntable (46 pages)
- 2171B Boresight Antenna Tower (64 pages)
- 2175 Antenna Tower (41 pages)
- 2181 Turntable (44 pages)
- 2187 Turntable (36 pages)
- 2188 Turntable (39 pages)
- 7-TR Tripod Positioner (49 pages)
- 7000-001 EMCenter Modular RF Platform (41 pages)
- 7405 E & H Near Field Probe Set (51 pages)
- 91197-1 Current Probe (57 pages)
- 95236-1 Current Probe (27 pages)
- HI-1501 Microwave Oven Survey Meter (28 pages)
- HI-1600 Microwave Oven Survey Meter (26 pages)
- HI-1710A Microwave Oven Survey Meter (57 pages)
- HI-1801 Microwave Oven Survey Meter (24 pages)
- HI-2200 RF Survey Meter (53 pages)
- HI-2602 Interlock Monitor (22 pages)
- HI-2790B Calibration Comparison System (44 pages)
- HI-3603 VLF Survey Meter (55 pages)
- HI-3604 ELF Survey Meter (44 pages)
- HI-3624(A) Survey Meter (22 pages)
- HI-3627 ELF Magnetic Field Meter (36 pages)
- HI-3637 VLF Magnetic Field Meter (48 pages)
- HI-3638 ELV/VLF Electric Field Meter (41 pages)
- HI-3702 Induced Current Meter (34 pages)
- HI-3804 RF Industrial Compliance Meter (25 pages)
- HI-4416 Numeric EMF Readout Unit (38 pages)
- HI-4433-CH Magnetic Field Probe (42 pages)
- HI-6005 Electric Field Probe (152 pages)
- HI-6100 Field Monitor (71 pages)