Zeroing a sensor, Figure 30 zeroing sensor – Bird Technologies VPM3 User Manual
Page 40
32
2.
Create a graph of the forward and reflected average power as a function of
time:
a.
Select row 1 by clicking on the row name.
b.
Select Delete, under the Edit tab.
Note:
The first line of header information will be deleted.
c.
Click on cell B1.
d.
While holding down the Ctrl key, select columns B (Time), H (Avg
Fwd W), and J (Avg Rfl W).
e.
Select Chart, under the Insert tab.
Note:
The chart wizard should open.
f.
Select XY (Scatter).
g.
Select the Line subtype.
h.
Click Next.
i.
Click Next in the data range, which should already be set.
j.
Enter a title and names for the X and Y axes.
k.
Click Finish.
Note:
Other data can be graphed by selecting the appropriate col-
umns in step d.
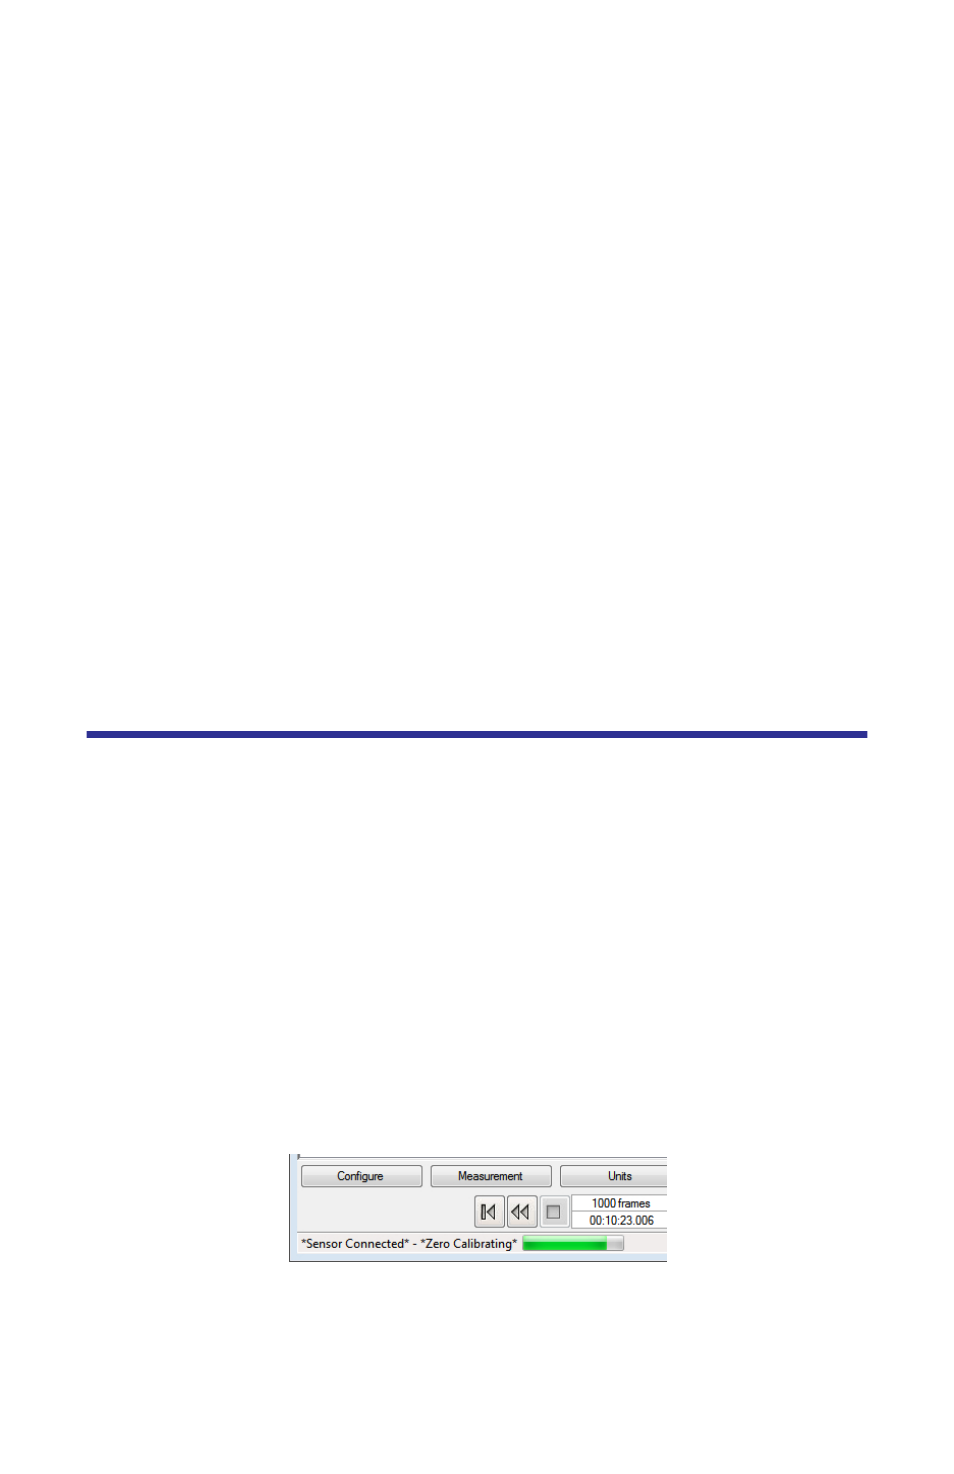
Zeroing a Sensor
1.
Check that no RF is in the system.
Note:
The sensor will read “~0.”
2.
Do one of the following:
Press the Measurement menu button.
Go to the Measurement menu and select the Zero menu item.
Note:
Calibration will take about 40 seconds. Do not interrupt the
calibration. A progress bar for the calibration will be displayed on the
screen.
Note:
Some soft key features will not be available for certain power
sensors.
3.
Press “Run” to resume data collection with the new Zero offset.
Figure
30
Zeroing Sensor