NTi Audio Acoustilyzer AL1 User Manual
Page 46
46
47
Application: FFT and White Noise
White noise is most often used as a test signal when measuring the
performance of acoustical systems. The FFT shows a flat spectrum with
this input signal. Feeding white noise into an electro-acoustic system and
measuring the FFT using a measurement microphone shows the frequency
response of the system with very high resolution.
Please note that the frequency response seen is most often a combination
of two effects:
a) The “real” frequency response of the electronics and speakers
b) Interference effects (resulting in comb filtering)
With a high resolution FFT, interference effects can easily be seen - while
they are nearly impossible to notice on a 1/3 octave resolution RTA.
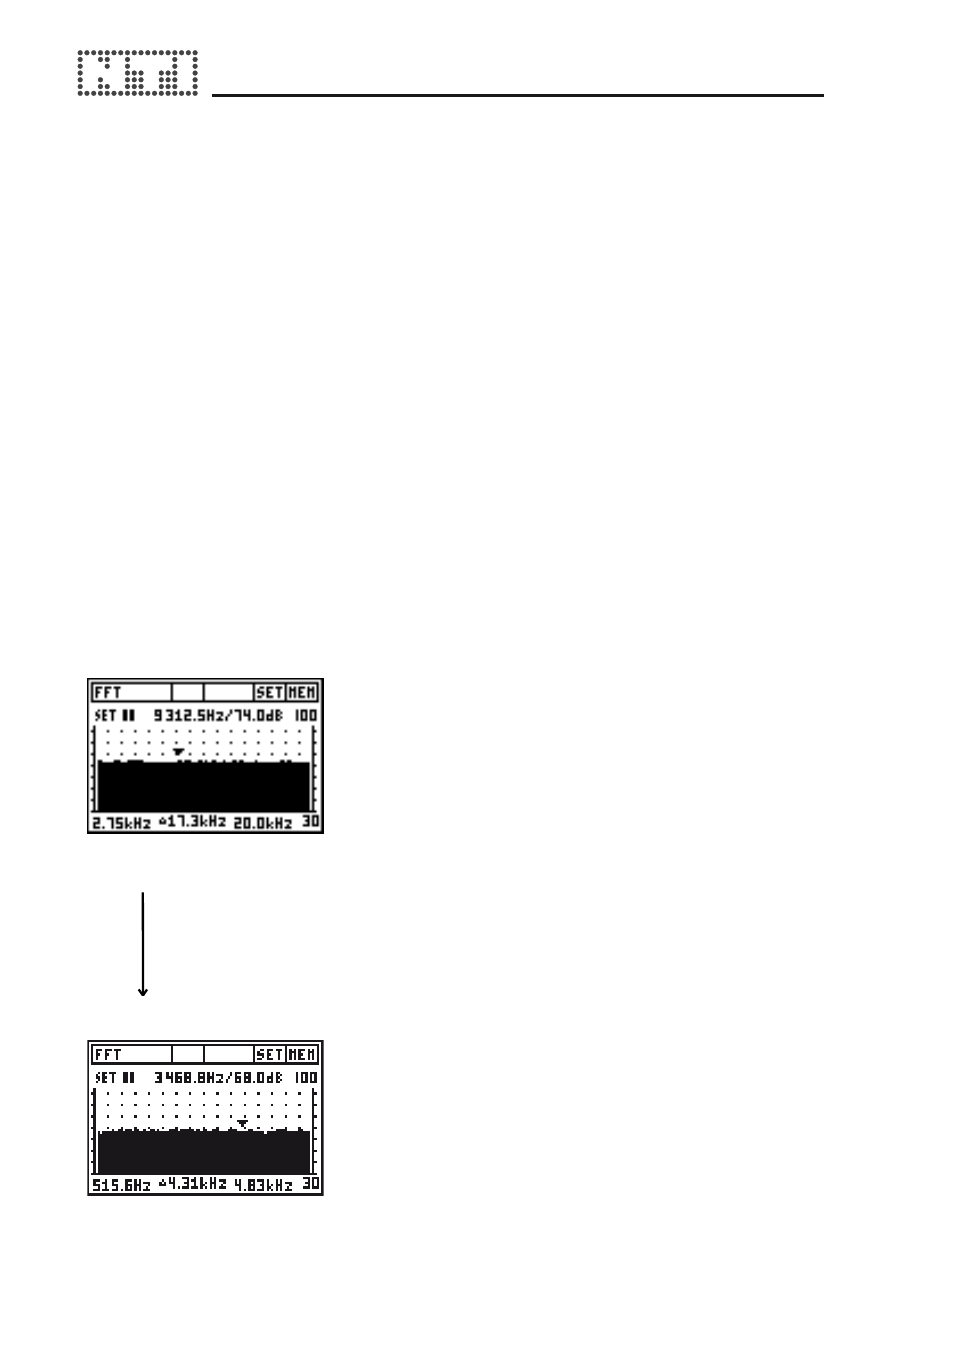
With the Zoom FFT of the AL1 you can “Zoom In” at any frequency point to
a resolution of up to 0.73 Hz.
4 x zoom →
level reduces
by 6 dB
White Noise and Zooming
The energy of “White Noise” is equally
distributed over the linear frequency axis.
Let’s assume we have a White Noise signal
with a level of 0 dB measured using a
bandwidth of 20 kHz.
What happens if we decrease the
measurement bandwidth to 10 kHz?
→ We only measure one half of the energy –
resulting in a level of -3 dB (10*log10(0.5)).
This is exactly what happens if we
“Zoom In” using an FFT. Every time we
“Zoom In” the measurement bandwidth is
halved – resulting in a 3 dB lower level in
every bin.