NTi Audio Acoustilyzer AL1 User Manual
Page 41
40
41
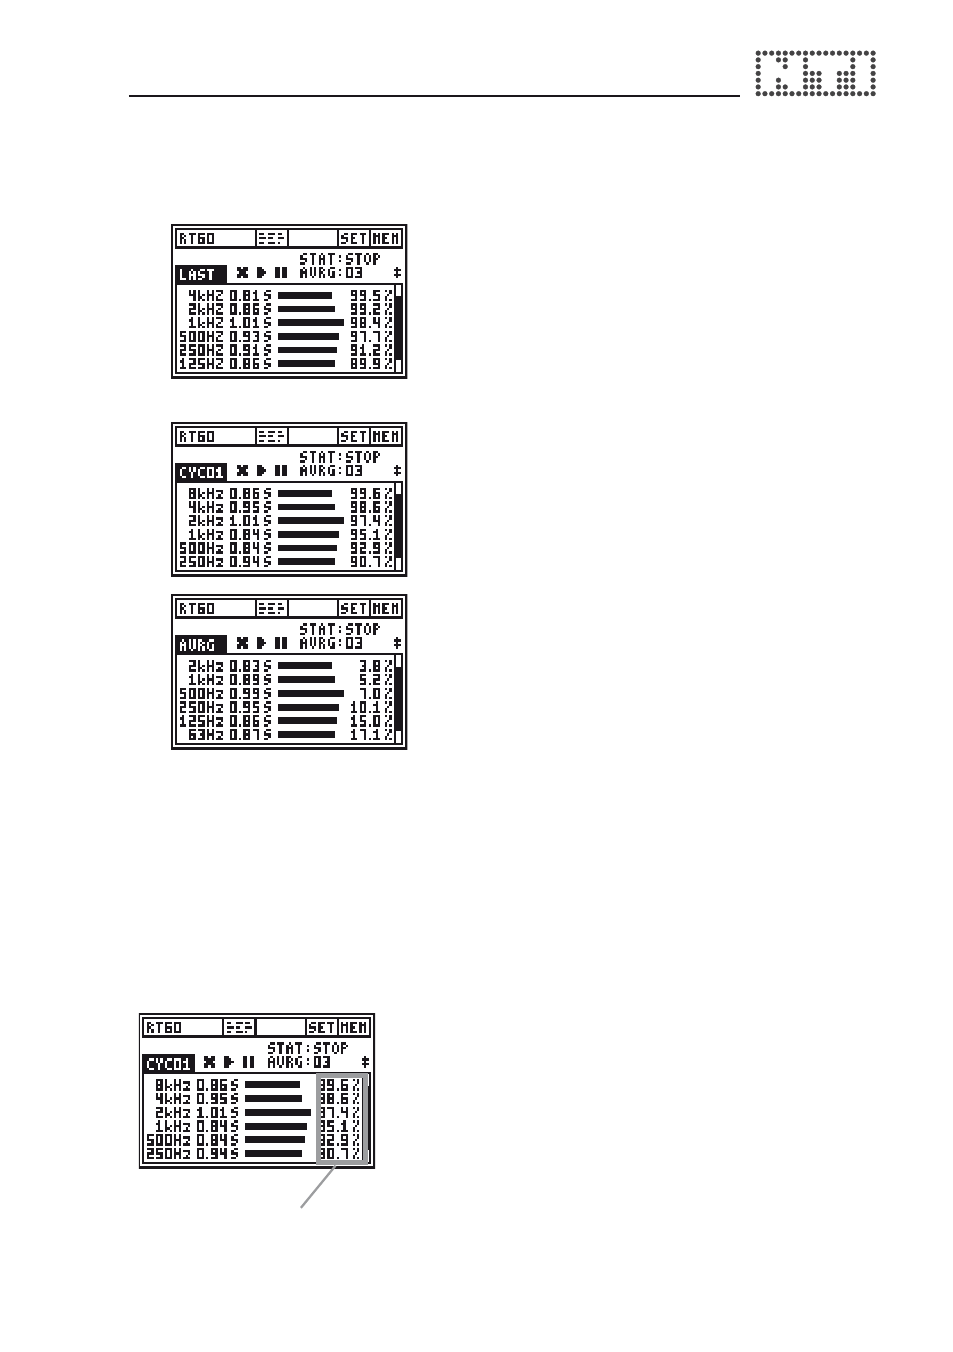
Toggle with the left and right AL1 cursor keys through the individual test
result cycles and the following results are displayed:
Last test result
The test result of the last test cycle is
displayed when selectiing LAST.
Additionally, you can use the upper and
lower cursor keys to display the 63 Hz or
8 kHz octave band test result.
Single test cycle results
The individual single test results are
marked with CYC xx, whereby xx is an
incrementing number.
Averaged test result
By selecting AVRG the averaged test
results of all measurements taken are
calculated and displayed. The correlation
factor is replaced by the measurement
uncertainty factor expressed in %.
Relative Test Result, displayed as bargraph: To simplify the data readout
the reverberation time is additionally displayed as a bargraph. The
bar with the maximum length shows the octave band with the longest
measured reverberation time. The other octave band test results are
displayed relative to this longest time.
Correlation
Factor in %
Correlation Factor in %
(applicable for single test results)
This factor will be 100% for perfect linear
sound pressure level decay after the
source is switched off. Deviations from
linearity result in lower correlation values.
(typically 80 - 100% for reliable RT60 test
results).