Det-Tronics PIR9400 PointWatch Infrared Hydrocarbon Gas Detector User Manual
Page 10
8
95-8440
9.3
It is important to note that whenever using transfer curve
data, the Model PIR
9400
analog signal output and any
real-time visual display of that output (such as a digital
display or bar graph) will be offset by a value indicated by
the transfer curve data, and therefore must be externally
correlated by the viewer.
The transfer curve data sheet for the gas of interest
includes five different curves — one for each standard
linearized output setting. To select the appropriate setting
for the detector, find the curve that:
1. Provides the closest signal correlation across the
desired gas measurement range, and
2. Ensures that the offset in the PIR
9400
signal output
versus gas concentration is an over-reading, as
opposed to an unsafe under-reading.
Ideally, at
50%
of full scale PIR
9400
output (
12
ma
signal level) the detected gas level will equal
50%
LFL
gas concentration, and this relationship will remain
proportional throughout the gas measurement range. In
reality, however, transfer curve data is non-linear, and will
result in varying offset levels from proportional linearity
throughout the gas measurement range. Refer to the
example in Figure
9
.
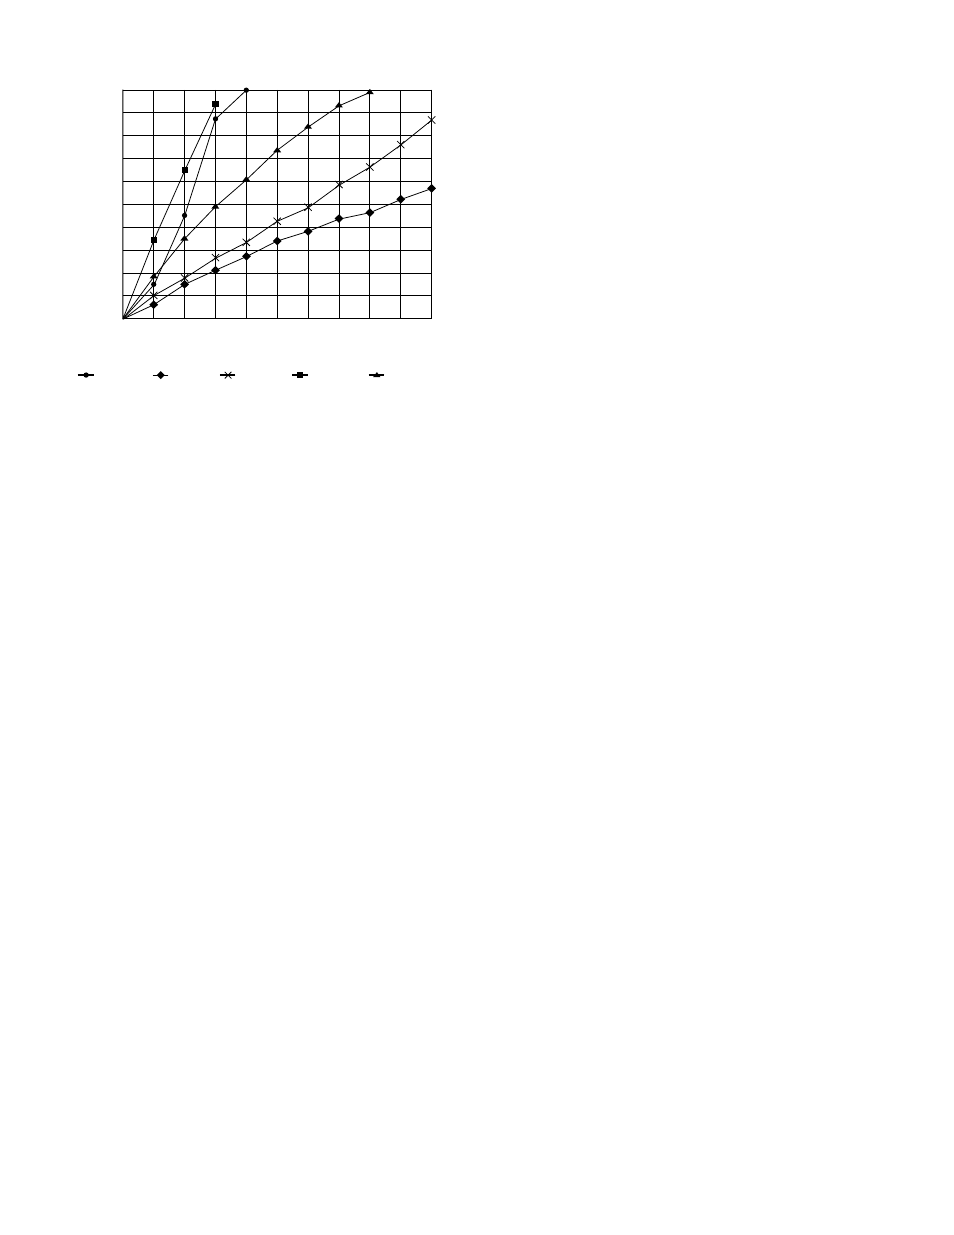
To use the transfer curve data, find the concentration (in
% LFL) for the gas of interest on the horizontal axis of the
graph. Follow the vertical line up from that point until it
intersects with a gas response curve. From the point of
intersection, follow the horizontal line directly to the left
until it intersects with the vertical axis of the graph.
The point of intersection with the vertical axis represents
PIR
9400
output (
0-100%
LFL reading, or
4-20
mA
proportionally) in response to the actual gas concentration
at the installation using that particular linearized output
setting.
In the example for gasoline vapor detection (Figure
9
),
the recommended PIR
9400
standard gas setting and
calibration gas to use is propylene. When using this
setting and calibration gas type, at
50%
LFL gasoline
concentration, the PIR
9400
signal output will be
73%
(
15
mA). The propane and ethane settings would not
be recommended, since the signal output level is much
less than the actual gas concentration in the field. The
methane and ethylene settings are acceptable, but will
result in much higher readings than the gas level that is
actually present in the field.
Contact Detector Electronics Corporation (Det-Tronics
®
)
for additional information regarding PIR
9400
transfer
curves.
IR Module Removal and Gas Selection
iMPoRtant
Remove power before disassembling the
PointWatch Detector.
The electronics module of the PIR
9400
gas detector is
field-removable. There are four different revisions of the
IR module as listed below:
1. Aluminum type supplied with
6-32
captive flatblade
screws.
2. Stainless steel type supplied with
6-32
caphead
(Allen) screws (use
7/64
inch hex driver).
3. Aluminum type supplied with M
5
caphead (Allen)
screws.
4. Stainless steel type supplied with M
5
caphead
(Allen) screws.
The M
5
metric caphead screws were implemented as
a standard design beginning in mid-
2003
in order to
comply with ATEX product approval requirements. In
addition, the electronics mounting cover is factory-
tightened to a torque setting of
15
Newton-meters, and
requires the use of the cover removal tool. Do not use an
improper tool such as pliers or vise grip.
1. Completely loosen the captive screws on the flat end
of the detector using the appropriate tool (flatblade
screwdriver or Allen wrench) and slide off the weather
baffle assembly. See Figures
10
and
11
.
ETHANE
PROPANE
ETHYLENE
PROPYLENE
METHANE
0
0
10
20
30
40
50
60
70
80
90
100
10
20
30
40
50
60
70
80
90
100
GASOLINE %LFL
POINTWATCH GAS RESPONSE CURVES
POINTW
A
TCH OUTPUT (% LFL)
C2020
Figure 9—Example of a PIR9400 Transfer Curve for Gasoline,
at Tamb = 25°C