AiM MyChron4 660 User Manual
Page 30
MyChron4 660
User Manual
Release 1.03
www.aim-sportline.com
29
RPM
values graph
Pressing MEM/OK key for the second time, you pass on to
the graph page of RPM and Shaft.
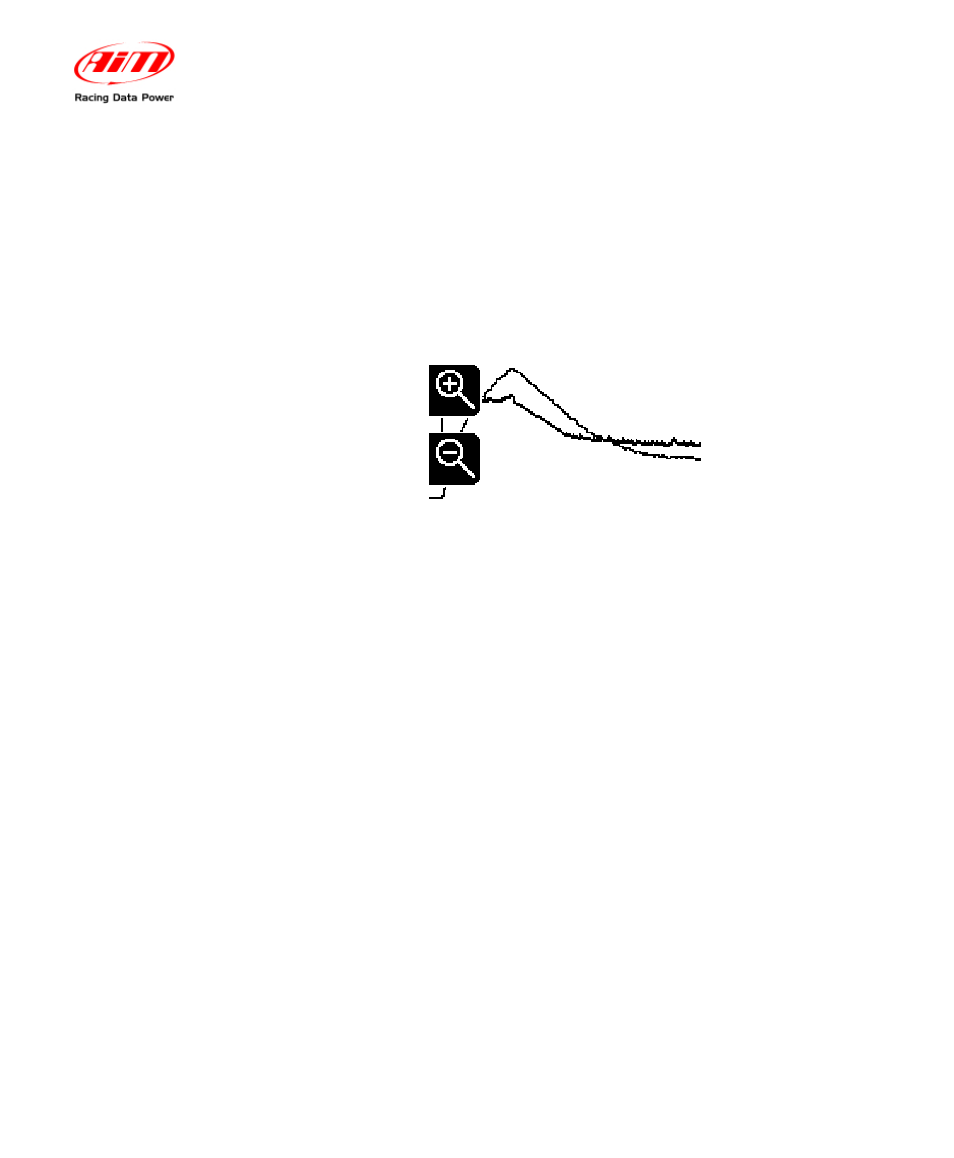
For the first 3 seconds the screen with the magnifying glass
icons is shown (see image below).
After 3 seconds the icons disappear.
Now it is possible to see the next graph page.
In the left part of the graph, the vertical axis shows RPM
trend value configured.
In the graph two lines corresponding to RPM and Shaft are
shown.
The bold line shows the trend of RPM in the session while
the light line shows the trend of Shaft.
Moving with “<<” and “>>”keys, you can zoom in to visualize
in detail the starting, with acquisition intervals of 3.2 seconds.
This operation can be done up to 6 times.
In the next page all 6 visualizations are shown.