12 frequency domain information, 1 frequency, 2 magnitude – Cirrus Logic CDB5461AU User Manual
Page 24: 3 s/pn, 4 sinad, 5 s/d, Figure 14. fft analysis, Cdb5461au
CDB5461AU
24
DS661DB1
2.8.12
Frequency Domain Information
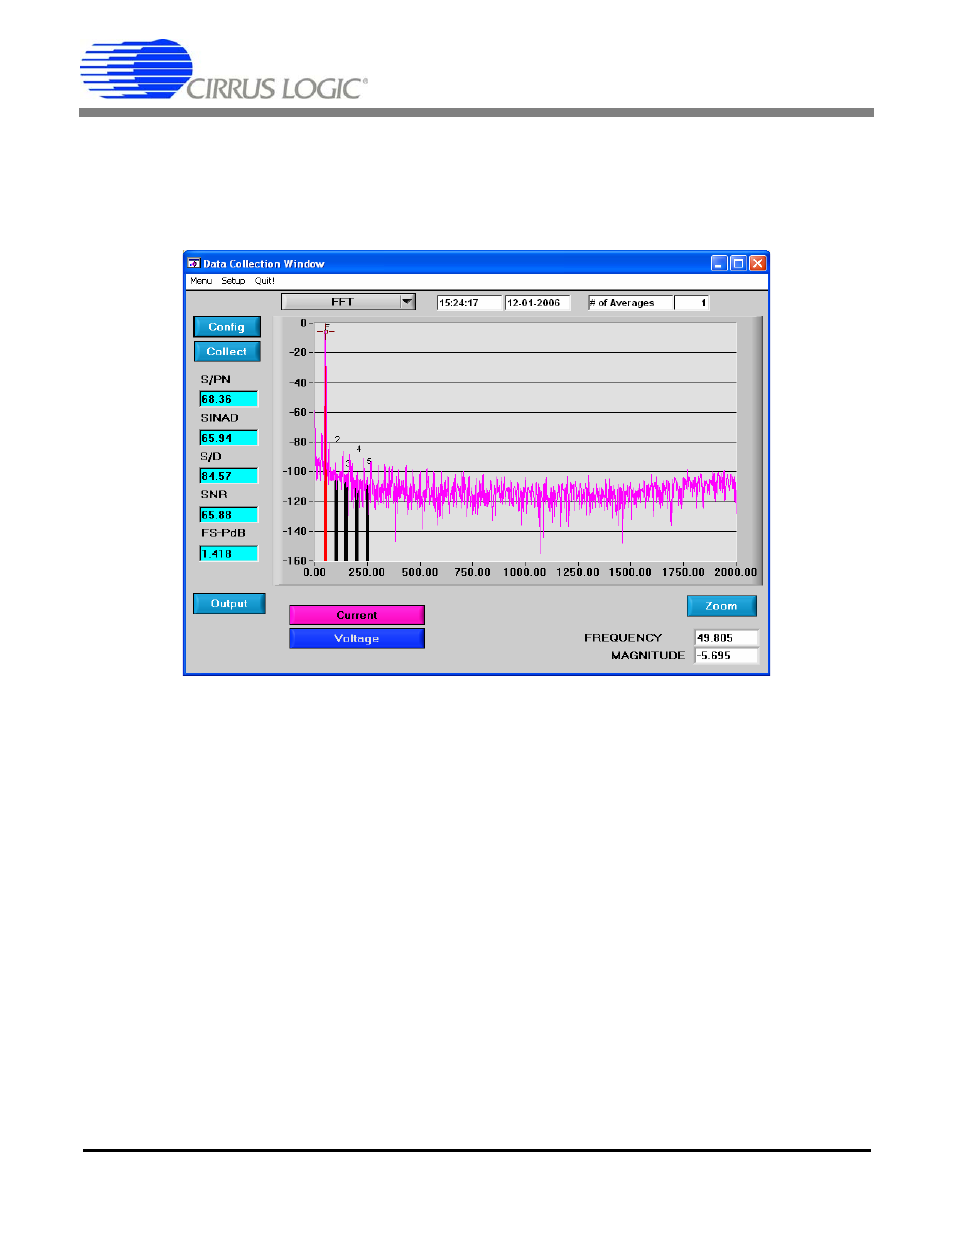
The following describe the indicators associated with FFT (Fast Fourier Transform) analysis. FFT data can be plot-
ted in the Data Collection window by setting the Time Domain / FFT / Histogram selector to FFT (Figure 14).
Figure 14. FFT Analysis
2.8.12.1
Frequency
Displays the x-axis value of the cursor on the FFT display.
2.8.12.2
Magnitude
Displays the y-axis value of the cursor on the FFT display.
2.8.12.3
S/PN
Indicator for the signal-to-peak noise ratio (decibels).
2.8.12.4
SINAD
Indicator for the signal-plus-noise-plus-distortion to noise-plus-distortion ratio (decibels).
2.8.12.5
S/D
Indicator for the signal-to-distortion ratio, 4 harmonics are used in the calculations (decibels).
See also other documents in the category Cirrus Logic Hardware:
- CobraNet (147 pages)
- CS4961xx (54 pages)
- CS150x (8 pages)
- CS1601 (2 pages)
- CS1501 (16 pages)
- CS1601 (16 pages)
- CS1610 (16 pages)
- CRD1610-8W (24 pages)
- CRD1611-8W (25 pages)
- CDB1610-8W (21 pages)
- CS1610A (18 pages)
- CDB1611-8W (21 pages)
- CDB1610A-8W (21 pages)
- CDB1611A-8W (21 pages)
- CRD1610A-8W (24 pages)
- CRD1611A-8W (25 pages)
- CS1615 (16 pages)
- AN403 (15 pages)
- AN401 (14 pages)
- AN400 (15 pages)
- AN375 (27 pages)
- AN376 (9 pages)
- CRD1615-8W (22 pages)
- CRD1616-8W (23 pages)
- AN402 (14 pages)
- AN404 (15 pages)
- CRD1615A-8W (21 pages)
- CS1615A (16 pages)
- CS1630 (56 pages)
- AN374 (35 pages)
- AN368 (80 pages)
- CRD1630-10W (24 pages)
- CRD1631-10W (25 pages)
- CS1680 (16 pages)
- AN405 (13 pages)
- AN379 (31 pages)
- CRD1680-7W (31 pages)
- AN335 (10 pages)
- AN334 (6 pages)
- AN312 (14 pages)
- AN Integrating CobraNet into Audio Products (16 pages)
- CobraNet Audio Routing Primer (9 pages)
- Bundle Assignments in CobraNet Systems (3 pages)
- CS2300-01 (3 pages)
- CS2000-CP (38 pages)