5 water-density and barometric corrections, 6 menus, Water-density and barometric corrections – Campbell Scientific OBS-3A Turbidity and Temperature Monitoring System User Manual
Page 21: Menus
OBS-3A Turbidity and Temperature Monitoring System
Blow on the temperature sensor to observe an increase in temperature (red
trace line on the top plot).
Dip the sensor in salty water and conductivity will increase (aqua trace line on
the top plot).
Wave your hand in from of the OBS sensor; the turbidity signal will fluctuate
and data will scroll (green trace line on the middle plot).
Blow into the pressure sensor and a small elevation in the pressure signal will
occur (blue trace line on bottom plot).
Click on OBS-3A Configurations | Information to view Sampling, Serial
Numbers, Calibration Dates, and Firmware.
6.5 Water-Density and Barometric Corrections
Since depths are estimated from pressure measurements, it is important to set
the water temperature and salinity so the OBS-3A can correct for water density
and calculate depth in meters or feet (this will not affect temperature or salinity
measurements). Also, the sensor measures absolute pressure so another
correction must be made for barometric pressure. Be sure to do this while the
OBS-3A is at the surface. Doing so when the instrument is submerged will
result in large errors in the depth measurement. The error will be
approximately equal to the instrument depth when the correction is made.
Depending on the magnitude of barometric pressure fluctuations at the
sampling site and the desired accuracy, you may want to correct data for
atmospheric effects using barometric pressure simultaneously recorded at a
nearby site.
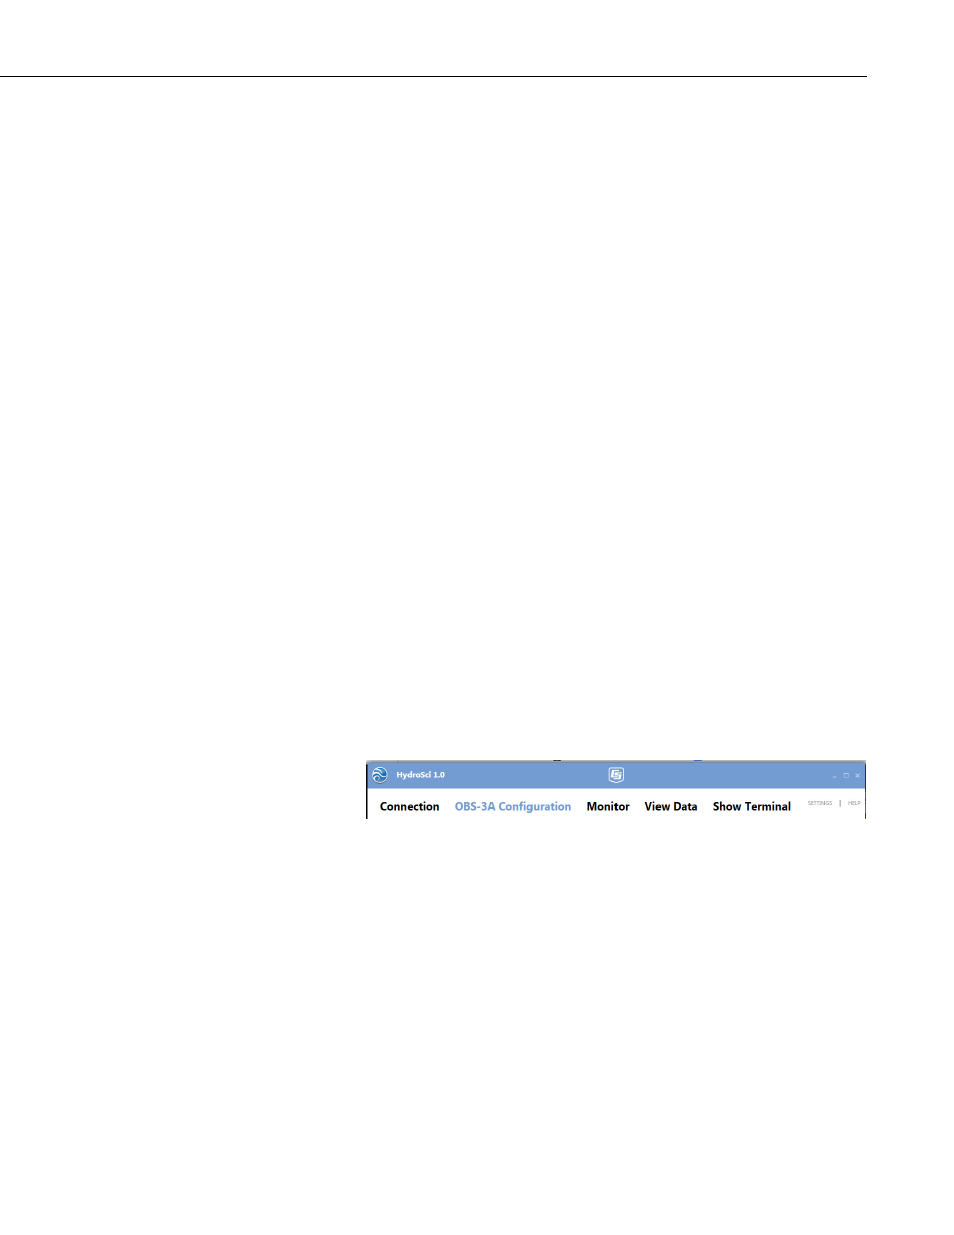
6.6 Menus
HydroSci has five tabs: Connection, OBS-3A Configuration, Monitor, View
Data, and Show Terminal.
Connection menu is used for connecting and disconnecting the sensor, as
mentioned above.
OBS-3A Configuration tab allows you to view information about your sensor,
perform operations, or set up your OBS-3A in a survey, cyclic, scheduled, or
setpoint configuration. Further detail will be discussed below.
The Monitor screen can be used to monitor the current survey data. You can
choose to view data in a graphical format or a tabular format.
The View Data tab can be used to view data stored on the OBS-3A from
cyclic, scheduled, and setpoint surveys. (When running in survey
configuration, data is not stored to the OBS-3A.)
13