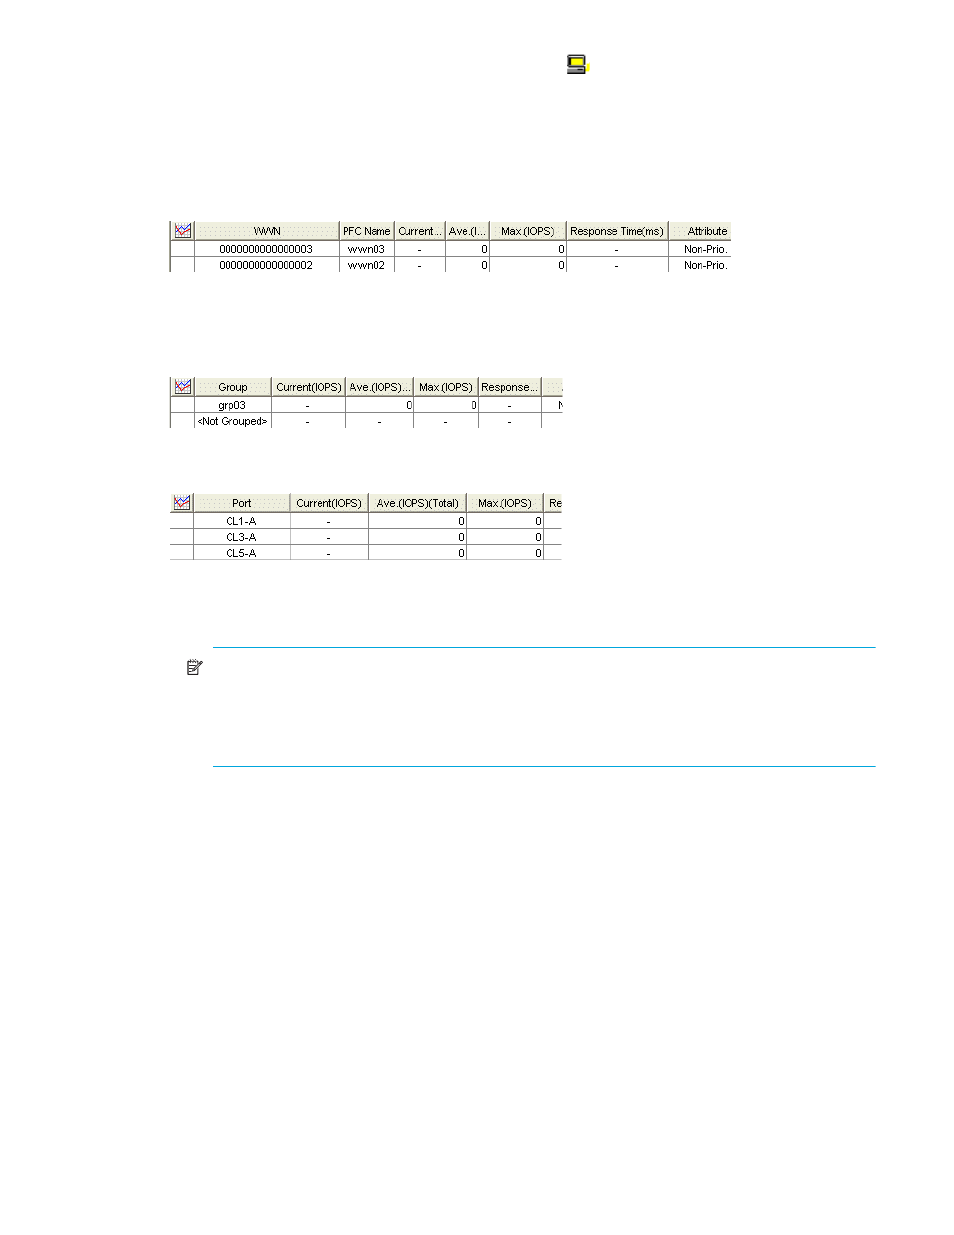
Figure 34 traffic statistics for host bus adapters, Figure 35 traffic statistics for each pfc group, 34 traffic statistics for host bus adapters – HP StorageWorks XP Remote Web Console Software User Manual
Page 61: 35 traffic statistics for each pfc group

Auto LUN XP user guide for the XP12000/XP10000
61
• If you double-click Not Grouped, host bus adapters (
) that do not belong to any PFC group are
displayed.
2.
In the list on the right side of the pane, do either of the following:
• To view I/O rates, select IOPS.
• To view transfer rates, select 100KB/s (MB/s [XP 12000]).
3.
In the tree view, do one of the following:
• To view traffic statistics for host bus adapters in a PFC group, click the PFC group.
Figure 34
Traffic statistics for host bus adapters
• To view traffic statistics for host bus adapters that do not belong to any PFC group, click Not
Grouped (see
• To view the I/O or transfer rates at each PFC group, click the Subsystem folder.
Figure 35
Traffic statistics for each PFC group
• To view traffic statistics for each port connected to a given host bus adapter, click the HBA.
Figure 36
Traffic statistics for each port connected to a specified HBA
4.
To find out how traffic has changed, in the table, click the PFC groups or WWNs, and click Draw. A
graph appears below the table.
NOTE:
If a host bus adapter’s WWN is displayed in red in the tree view, the host bus adapter is
connected to two or more ports, but Performance Control XP does not control traffic between the
HBA and some ports. When many-to-many connections are established between HBAs and ports,
monitor all traffic between HBAs and ports. For information about controlling traffic between the
HBA and connected ports, see HP StorageWorks Performance Control XP user guide.
5.
To view more detailed information in the graph, click the Detail check box on the lower-right side of the
table, and click Draw. The graph contents change.
The table displays the following:
•
Graph column: The check mark icon indicates the graph is currently illustrating data for that item.
•
Group: PFC groups.
•
PFC Name: PFC names of host bus adapters.
•
Port: Ports on the disk array.
•
Current: Current I/O or transfer rate.
•
Ave.: Average I/O or transfer rate for the specified period.
•
Max.: Maximum I/O or transfer rate for the specified period.
•
Response Time: Time between when the DKC receives the read/write command and when the DKC
responds to the command. The value is average response time over one minute.
•
Attribute: Priority of each host bus adapter. Prio. indicates a high-priority HBA (prioritized WWN).
Non-Prio. indicates a low-priority HBA (non-prioritized WWN). When calculating I/O rates displayed
in the All Prio. row, Auto LUN XP uses I/O rates of other prioritized ports.
