Workload and traffic statistics – HP StorageWorks XP Remote Web Console Software User Manual
Page 57

Auto LUN XP user guide for the XP12000/XP10000
57
2.
Do any of the following:
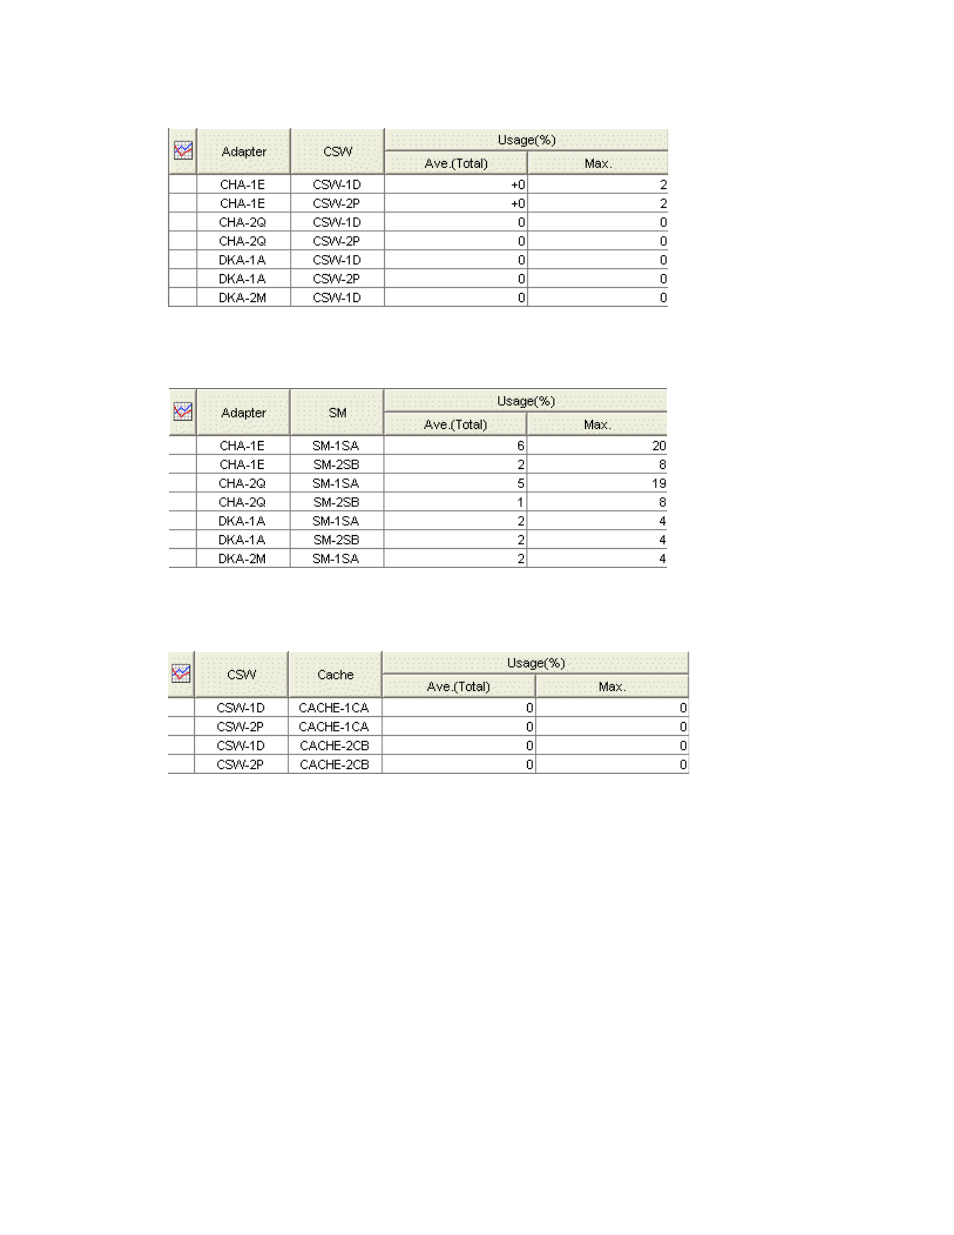
• To check usage statistics about paths between adapters (CHAs and DKAs) and the cache switch,
click Adapter-CSW below the Access Path Usage folder.
Figure 24
Usage statistics about paths between adapters and the cache switch
• To check usage statistics about paths between adapters (CHAs and DKAs) and shared memory,
click Adapter-SM below the Access Path Usage folder.
Figure 25
Usage statistics about paths between adapters and shared memory
• To check usage statistics about paths between cache switches and cache memory, click CSW-Cache
below the Access Path Usage folder.
Figure 26
Usage statistics about paths between cache switches and cache memory
3.
To display a graph illustrating changes in usage statistics about paths, click the paths in the table, and
click Draw.
The table displays the following items:
•
Graph column: The check mark icon indicates the graph is currently illustrating data for that item.
•
Usage(%): The Ave. (Total) column displays the average path usage rate in the specified period. The
Max. column displays the maximum path usage rate in the specified period.
Workload and traffic statistics
Collecting workload and traffic statistics about disk drives, ports, and LU paths
To obtain usage statistics about workloads, port traffic, LU path traffic, and traffic between host bus
adapters and ports, complete the following instructions to start monitoring the disk array:
1.
In the Auto LUN pane, click Monitoring Options. The Monitoring Options pane appears.
2.
Click Enable for the Current Status option.
3.
Use the Gathering Interval box to specify the collection interval during which the disk array collects
statistics. The interval in long range is fixed at 15 minutes.
