Status visualization – Milestone XProtect Smart Client 2013 User Manual
Page 69
Milestone XProtect
®
Smart Client
2014
User's Manual
www.milestonesys.com
69
Defining your views
Output
Click an output on the map to activate it, or right-click the output and select Activate Output. When
you click an output, the mouse pointer briefly changes to a lightning symbol to indicate that the output
is being activated.
Hot zones
A hot zone is usually colored, so it is easy to recognize. Click a hot zone to go to the sub-map
associated with the hot zone, or right-click the required hot zone and select Go to Sub-map.
If the hot zone appears with a dotted outline, no map is associated with the hot zone.
On some surveillance systems, maps from several different servers may be in a map hierarchy. This
can mean that when you click a hot zone, the sub-map is unavailable because its server is
unavailable. Servers can become unavailable because of scheduled maintenance or network
problems. Contact your surveillance system administrator if the problem persists.
A hot zone can point to a map that you do not have access rights to and the XProtect Smart Client will
inform you about this. Because user rights can be time-based, you might not be able to access a map
that you could previously. This can be because you do not have access during certain hours of the day
or certain days of the week. Contact your surveillance system administrator if in doubt about your user
rights.
Plug-ins
Plug-in elements are available only if used on your surveillance system. Examples of plug-in elements:
access control systems, fire detection systems, etc.
Interconnected hardware
Because interconnected hardware that is part of a Milestone Interconnect system is offline at times,
you may often see error statuses on the interconnected hardware element on a map.
Status visualization
Status visualization is a feature that graphically displays the status of elements added to a map. When
a map is fully operational and in the normal state, no visual status indication is presented. The Status
Visualization window lets you define the visual appearance of maps' status indication.
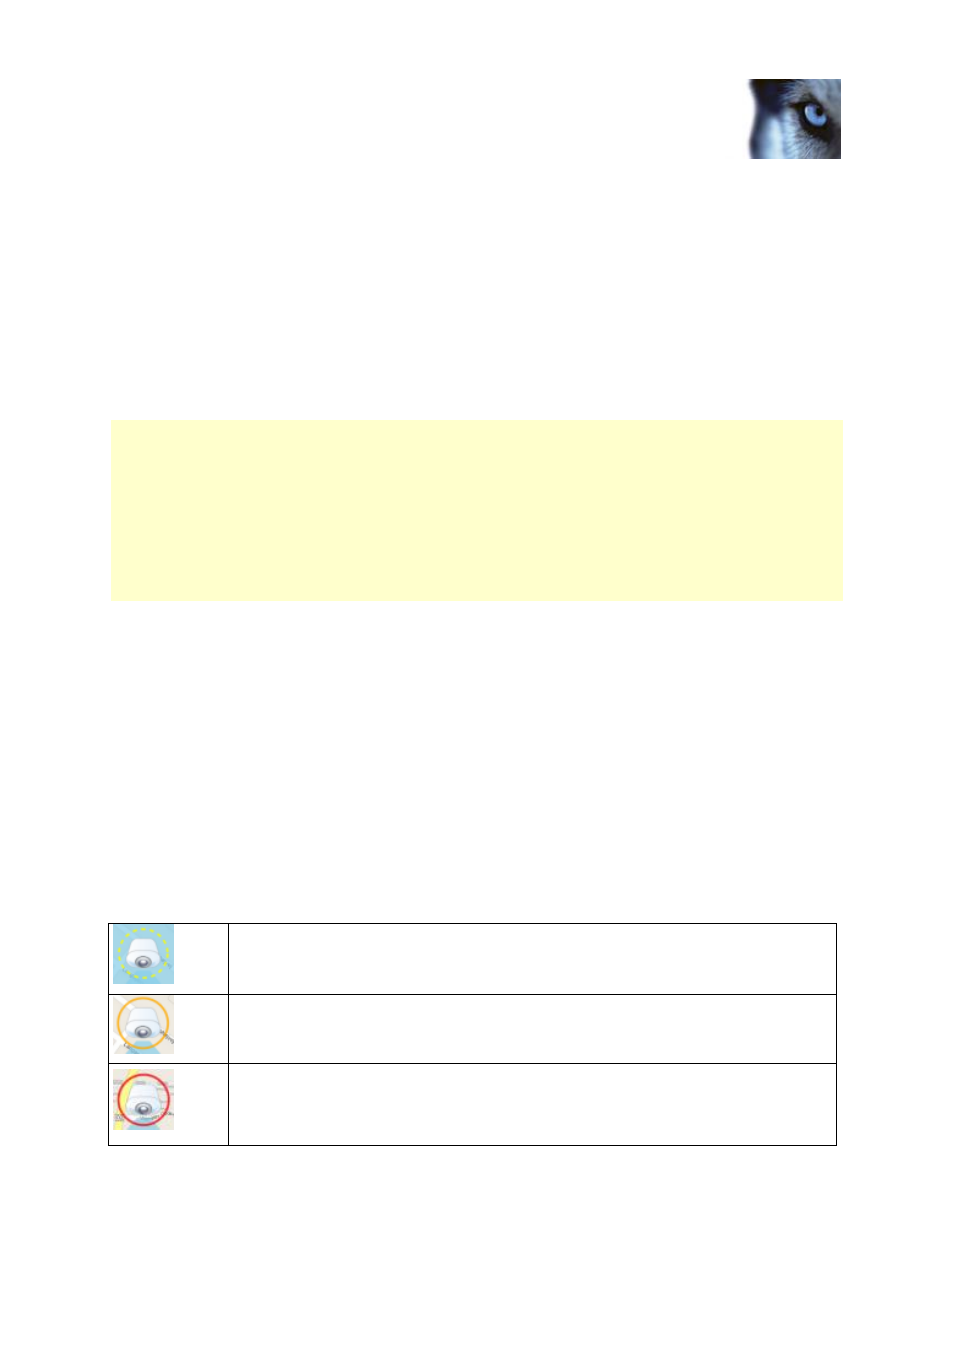
Attention needed
—when an element requires attention, but is still working; for
instance when a server is running out of disk space. Note that the device in question
is not necessarily included on the map. The default display color is yellow.
Not operational
—when there is an error on the element, for example if a server
cannot connect to a microphone or speaker. The default display color is orange.
Alarms
—when an element has an alarm attached to it. The default display color is
red.