Badger Meter ReadCenter User Manual
Page 20
Page 20
10-11
READCENTER® Reading Data Management
Graph
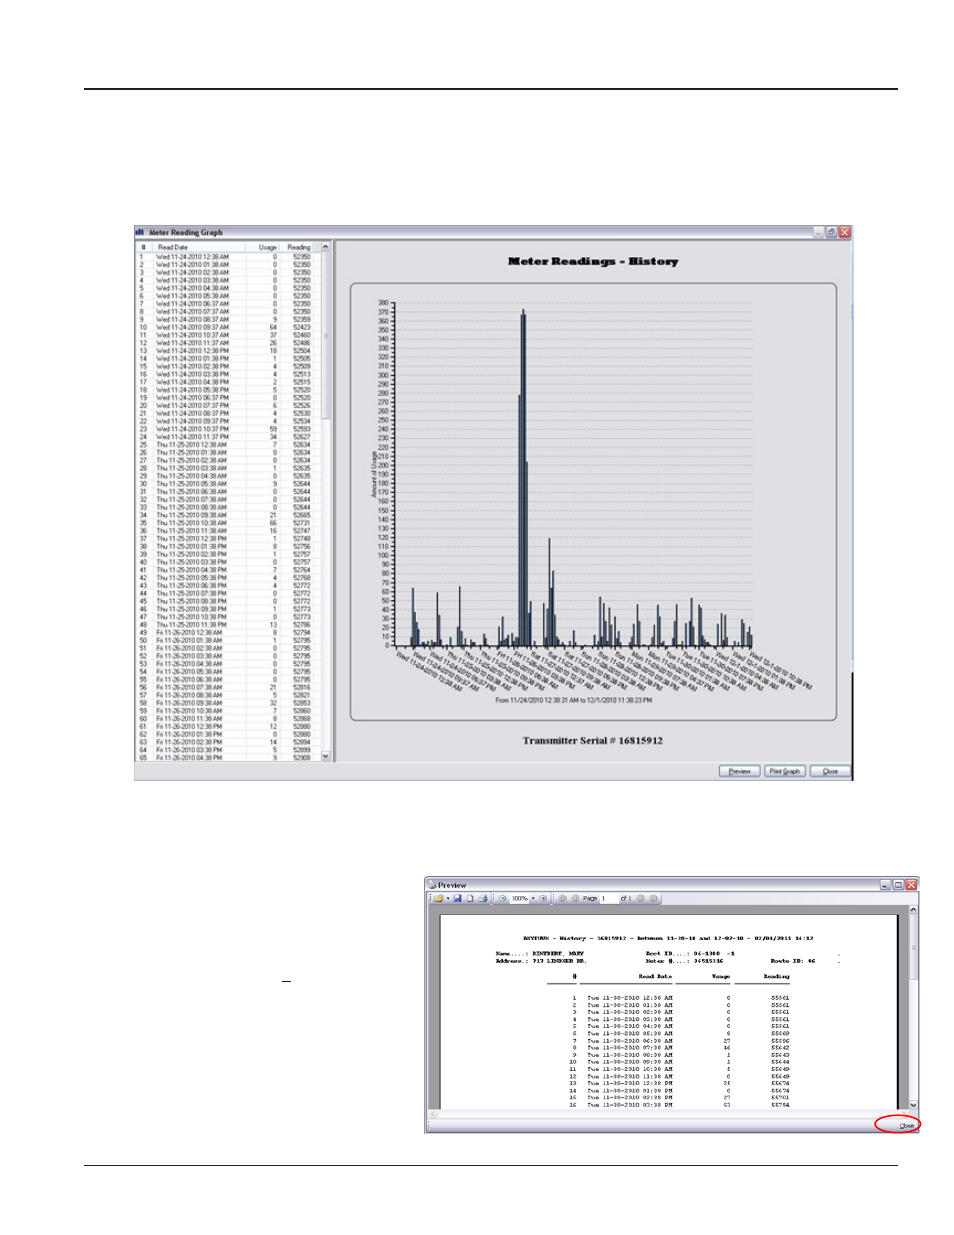
Click the Graph button to see usage calculations and a usage graph for meter readings shown in the History report. This
feature is also available in the Account Records function.
Here is a Meter Reading Graph example covering reads over a period of time.
Buttons
•
Print Graph: Open the print dialog box to select a printer.
•
Preview: Show a report of the customer and usage information. (Includes print option.)
Here is an example of the Preview
screen.
Click the red X at the top right of the
screen, or click the Close button at the
bottom right of the screen to return to
the Meter Reading Graph screen.
NOTE: For more information
about the tool bar on this screen,