SHIMPO FGS-100-PXL User Manual
Page 7
Viewing Test Results
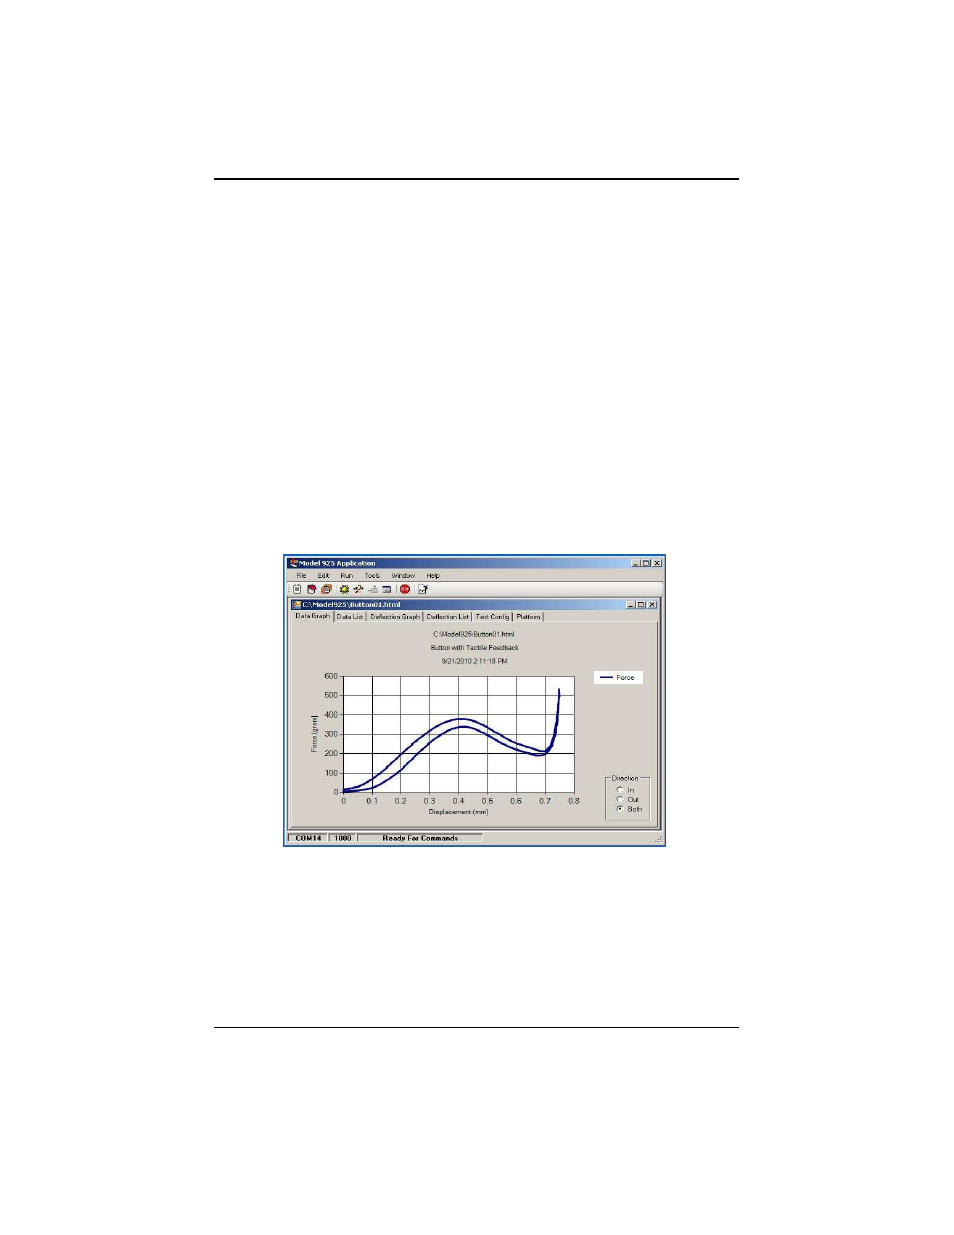
After a test run has been downloaded from the platform the test result window is displayed (Fig 9).
Test results from previously saved files in the "html" format can also be opened by the PC program. From
the menu select "File - Open - Test Data", browse to the desired folder and select the desired file.
The "Data Graph" tab (Fig 9) is the default view, with Force results as the Y axis and Displacement results
as the X axis. Both inward and outward directions are initially displayed and can be turned on or off
by clicking the desired option in the lower right hand corner of the window.
Calibration data can be viewed in the "Deflection Graph" tab which shows Displacement as the Y axis
and Force as the X axis.
Results can be viewed in tabular form by clicking on the "Data List" or "Deflection List" tab.
The "Test Config" tab shows the values of the configuration parameters at the time of the test.
The "Platform" tab shows various Platform settings at the time of the test.
Any of the views can be printed by selecting from the menu "File - Print". Graph views can be previewed
before printing.
Figure 9. Test Result - Data Graph
7