Sample data – PASCO TD-8579A COMPUTER-BASED THERMAL EXPANSION APPARATUS User Manual
Page 11
Computer-based Thermal Expansion Apparatus
012-07599C
®
8
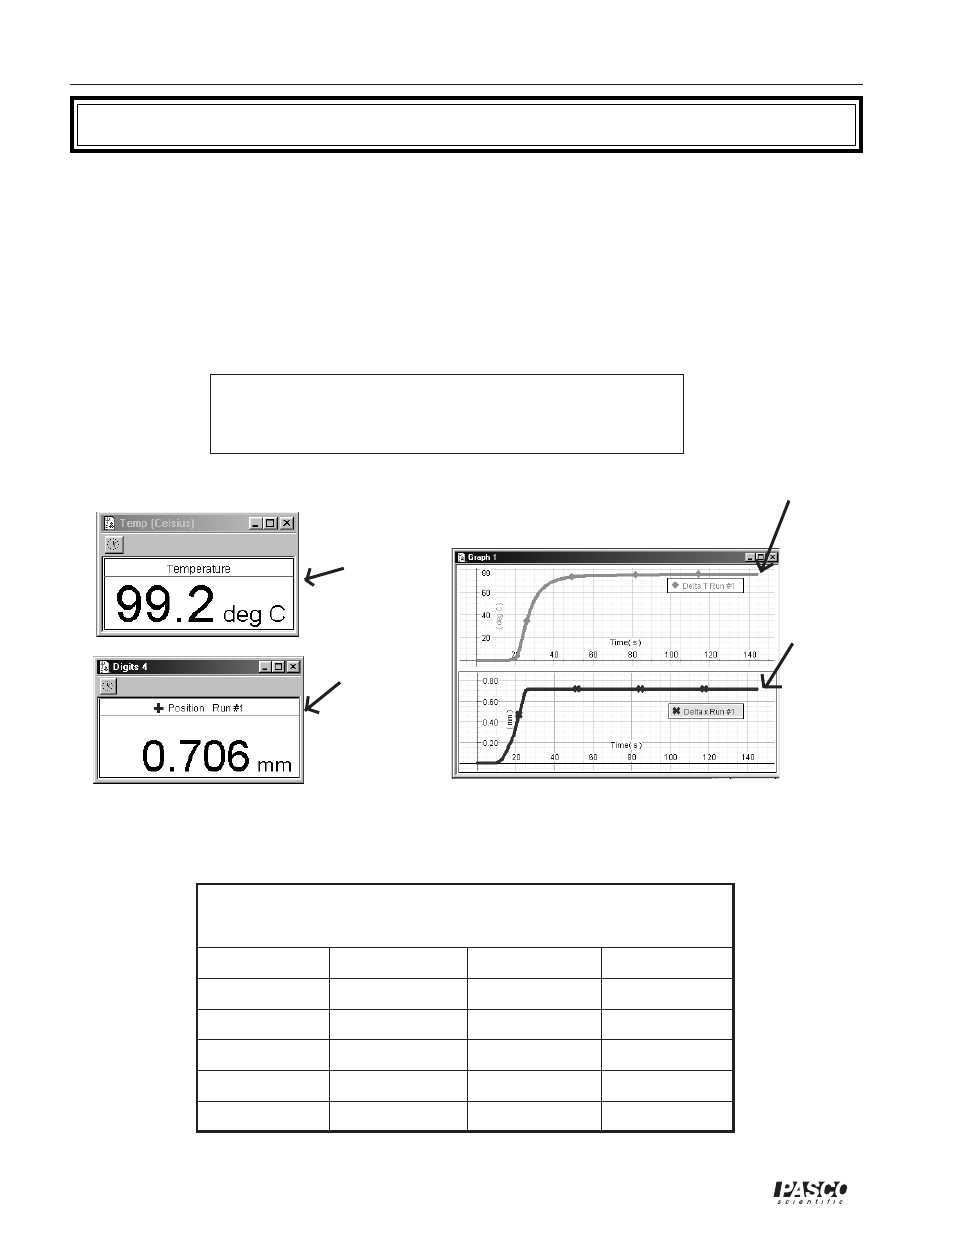
Sample Data
Figure 7: Data obtained during thermal expansion with
the aluminum tube
The following are examples of data obtained using DataStudio™, a ScienceWorkshop® 750
Interface and the TD-8556A Steam Generator. The data will vary according to experimental
conditions, setup modifications, temperature of the heat source, type of experiment, temperature
units (degrees K, F, or C), etc.
Within Datastudio, you can use the cursor to adjust the axes to fit your data inside the
Graph display. Other displays, such as the Digits or Table display, may be simultaneously
or later opened to view actual data values. You can use the Smart Tool to display the
coordinates for the values at room temperature and at the final temperature at equilibrum.
Note: The displays shown are in DataStudio version 1.5.2. DataStudio
displays are subject to future modifications with continuous upgrades.
The displays shown may not appear identical to those of later versions.
temperature at
equilibrium
maximum
expansion at
boiling point
maximum
temperature
change
maximum
length
change
16460 W 14 °C 12,490 W 20 °C 9,574 W 26 °C 7,404 W 32 °C
15710 W 15 °C 11,940 W 21 °C 9,166 W 27 °C 7,098 W 33 °C
15000 W 16 °C 11,420 W 22 °C 8,778 W 28 °C 6,808 W 34 °C
14320 W 17 °C 10,920 W 23 °C 8,408 W 29 °C 6,532 W 35 °C
13680 W 18 °C 10,450 W 24 °C 8,058 W 30 °C 6,268 W 36 °C
13070 W 19 °C 10,000 W 25 °C 7,722 W 31 °C 6,016 W 37 °C
Resistance to Temperature Conversion Chart
(10KW Thermistor)
Table 3: Resistance to Temperature Conversion Chart
(10 k
Ω
Thermistor)