E-series average power sensor specifications, Power linearity, Continued) – Atec Agilent-E4418B-E4419B User Manual
Page 14
2
1/9
1/7
1/5
1/3
1
.1/3
.1/5
.1/7
.1/9
.2
Qpxfs!)eCn*
.21!!!!!!!!!!.6!!!!!!!!!!!!!1!!!!!!!!!!!!!6!!!!!!!!!!!!21!!!!!!!!!!26!!!!!!!!!!!!31!!!!!!!!!!!36!!!!!!!!!!41
&!Fssps
E-Series average power sensor specifications
(continued)
14
Power linearity *
Sensor
E9300A, E9301A, E9304A
E9300B, E9301B
E9300H, E9301H
Power range
–30 to –20 dBm
–20 to –10 dBm
–10 to 0 dBm
0 to +10 dBm
+10 to +20 dBm
Measurement uncertainty
Measurement uncertainty
Measurement uncertainty
Power
–60 to –10 dBm
–10 to 0 dBm
0 to +20 dBm
–30 to +20 dBm
+20 to +30 dBm
+30 to +44 dBm
–50 to 0 dBm
0 to +10 dBm
+10 to +30 dBm
Linearity (25 °C ±10 °C)
±3.0%
±2.5%
±2.0%
±3.5%
±3.0%
±2.5%
±4.0%
±3.5%
±3.0%
Linearity (0 °C to 55 °C)
±3.5%
±3.0%
±2.5%
±4.0%
±3.5%
±3.0%
±5.0%
±4.0%
±3.5%
*after zero and calibration at ambient environmental conditions
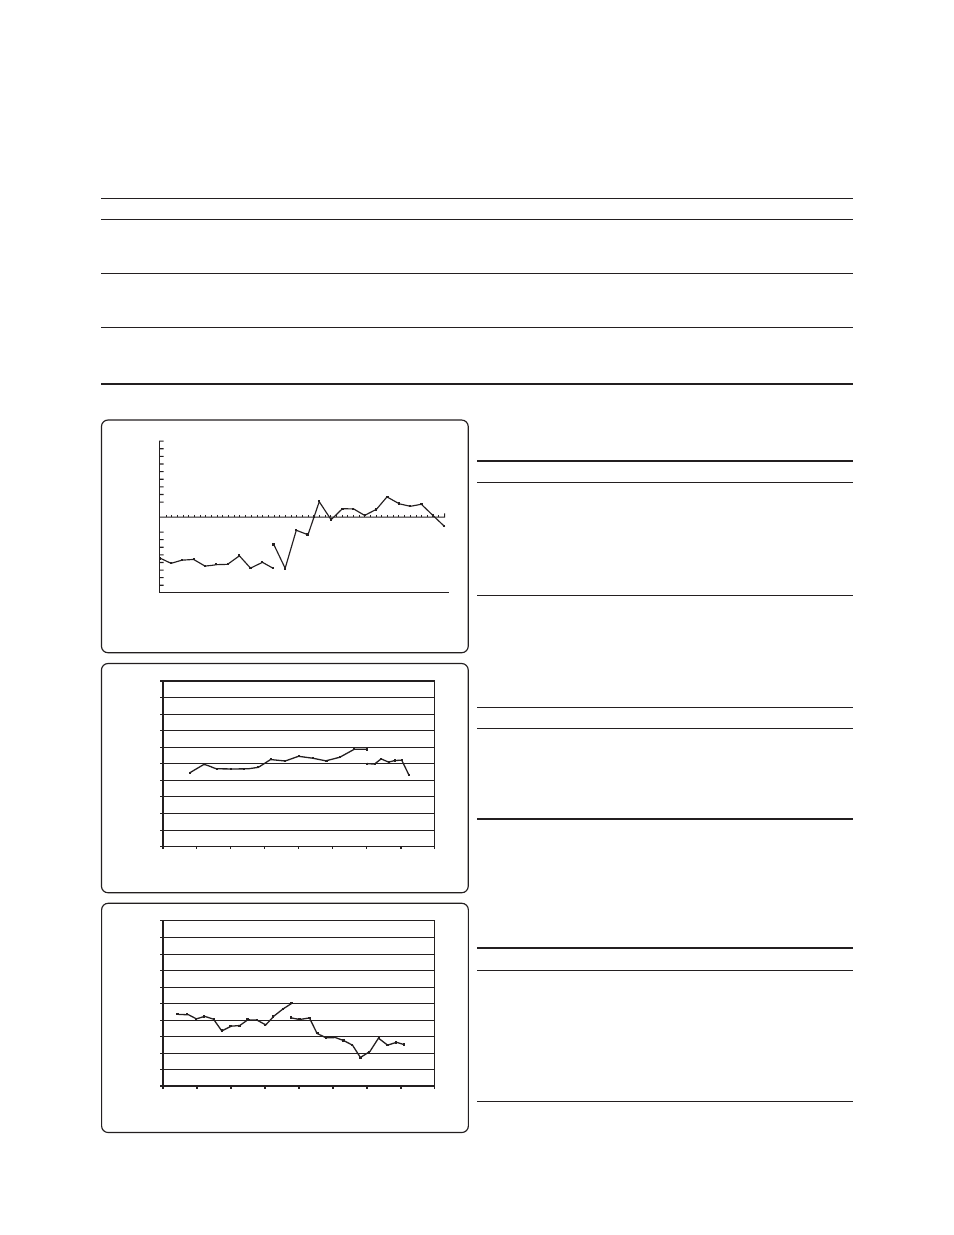
Table 9
Typical E9300A/01A/04A power linearity at 25 °C, after zero
and calibration, with associated measurement uncertainty
0.5
0.4
0.3
0.2
0.1
0
-0.1
-0.2
-0.3
-0.4
-0.5
Power (dBm)
-30
-26
-22
-18
-14
-10
-8
-2
2
6
10
14
18
20
% Error
Typical E9300B/01B power linearity at 25 °C, after zero and
calibration, with associated measurement uncertainty
Typical E9300H/01H power linearity at 25 °C, after zero and
calibration, with associated measurement uncertainty
Power (dBm)
Power (dBm)
% Error
% Error
1
0.8
0.6
0.4
0.2
0
-0.2
-0.4
-0.6
-0.8
-1
1
0.8
0.6
0.4
0.2
0
-0.2
-0.4
-0.6
-0.8
-1
-10 -5 0 5 10 15 20 25 30
-10 -5 0 5 10 15 20 25 30
Power range
–6 to 0 dBm
0 to +10 dBm
+10 to +20 dBm
+20 to +26 dBm
Power range
–26 to –20 dBm
–20 to –10 dBm
–10 to 0 dBm
0 to +10 dBm
+10 to +20 dBm
+20 to +26 dBm
± 0.65%
± 0.55%
± 0.45%
± 0.31%
± 0.9%
± 0.8%
± 0.65%
± 0.55%
± 0.45%
± 0.31%
±0.9%
±0.8%
±0.65%
±0.55%
±0.45%