Atec Agilent-J3763A User Manual
Page 21

21
21
21
21
21
Specify traffic rates by:
- 1% to 100 % utilization
- interframe flags
- frames per second (30,000/sec)
- interframe delay (milliseconds)
Maximum measured line rate 99%
Maximum number of different frames allowed 20
Define up to 4 different blocks, each having different traffic levels and
patterns
Use Quick Tests for commonly used message types
Interfaces supported V.24/V.28/RS-232C, V.35, V.36/RS-449/422/423/530, X.21, T1,
E1, HSSI, and DS3
Clock source DTE/equipment, DCE/Line, internal, or recovered
(50 bps to 52 Mbps)
Full bandwidth, channelized (DS1), fractional (DS0) on DS3 traffic generation
L
LL
LLiiiiin
n
n
n
ne
e
e
e
e S
S
S
S
Sttttta
a
a
a
atttttu
u
u
u
us
ss
ss
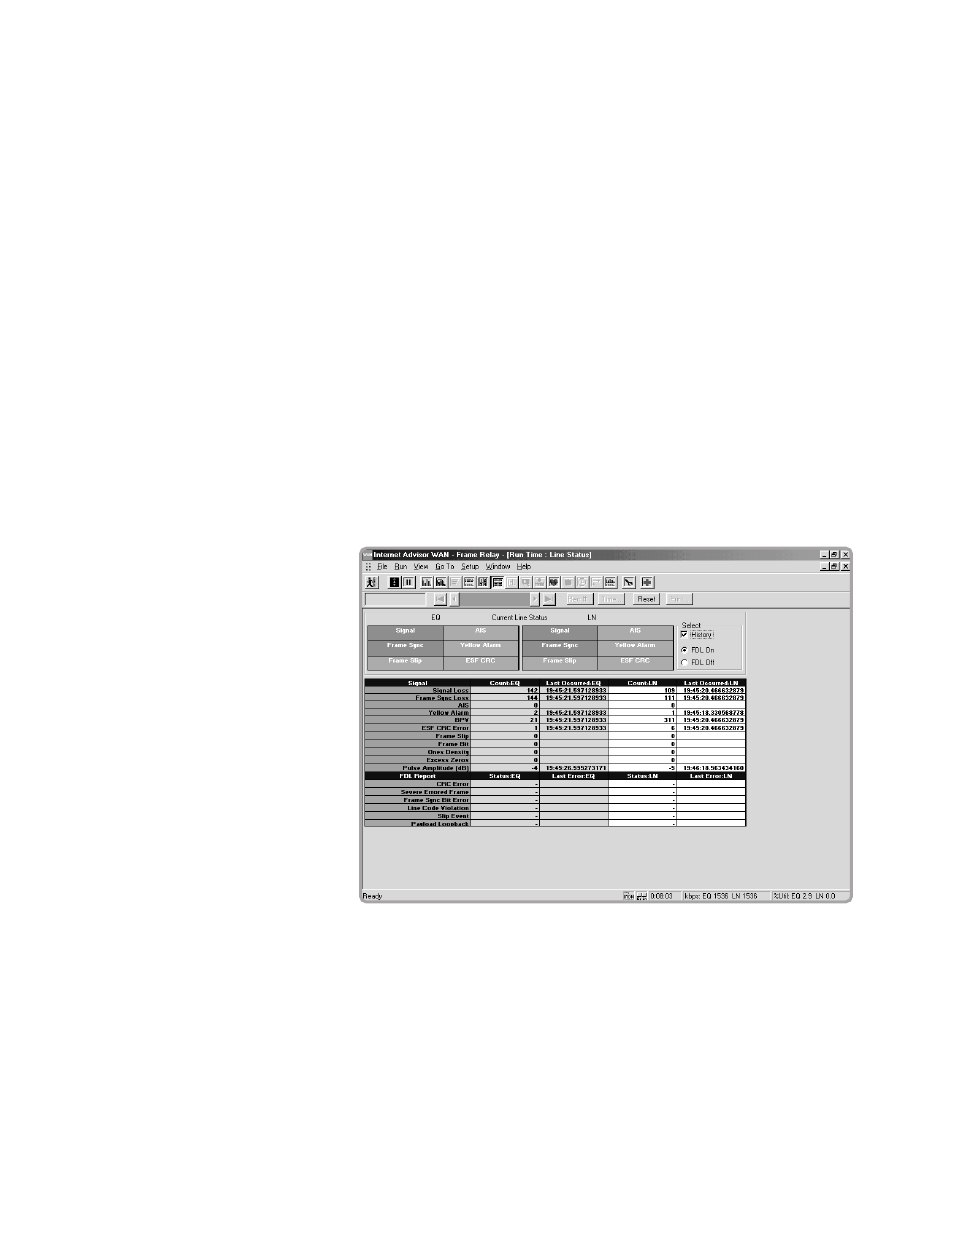
The operation of the physical interface is often critical in determining the cause
of network problems. Therefore, the Advisor tracks errors at the physical layer,
and stamps the information with a 1 ms time stamp. Counts of error and alarm
events are recorded on the display for both the line (network) and equipment
(user) side. The time of the last occurrence of a particular event is recorded as
well. Events are saved in the buffer and can be logged to disk.
Line status is displayed in real time. All of the events listed below are saved in
the buffer and counted in the line status display. These events may be logged to
disk. The current status of critical parameters (marked with an asterisk (*)) is
also displayed in large green or red boxes in the line status display, for easy,
at-a-glance viewing.
Included in this application, there is a power meter of pulse amplitude
measurement (signal strength) for detecting weak signal conditions which can
cause transmission errors.
F
FF
FF igur
igur
igur
igur
igure
e
e
e
e 1
11
115:
5:
5:
5:
5: L
LL
LL i n
i n
i n
i n
i ne
e
e
e
e s
ss
ssttttt a
a
a
a
attttt u
u
u
u
us.
s.
s.
s.
s.
