Ocean Optics Overture User Manual
Page 32
Chapter 4: Experiments
24
000-20000-400-01-201108
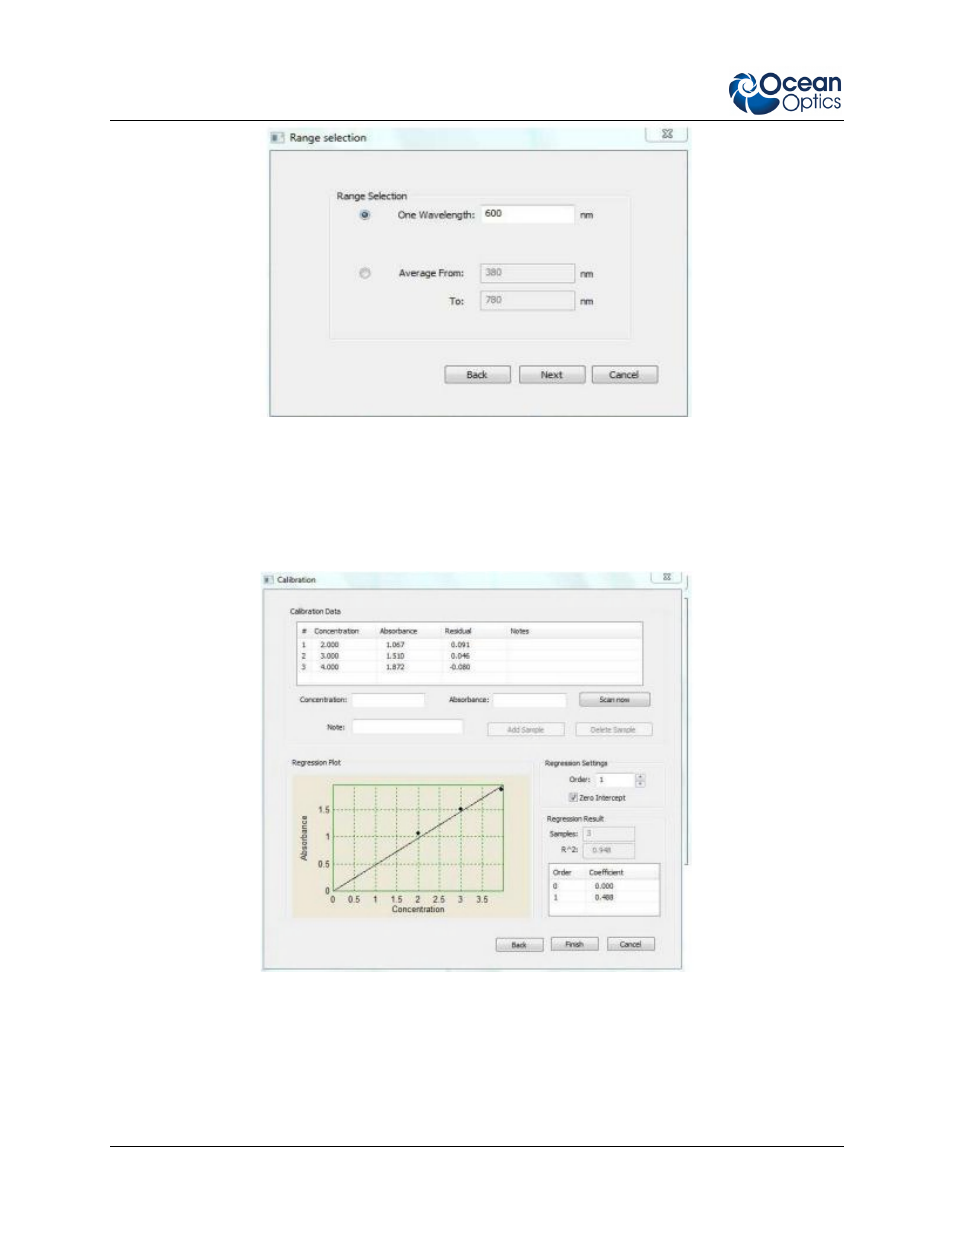
6. Create the calibration curve. Take at least three samples of known concentration. Either enter
the Absorbance by hand from your notes or scan for it using the Scan now button. When you
enter the third sample a regression line will be plotted. The line can be displayed in first or second
order and forced through the origin. Values for the molar extinction coefficient and R
2
are
calculated.
7. Concentration meter. Now you can place any unknown concentration of your compound into
the cuvette holder and Overture software will give you an instant reading of the concentration and
show where it sits on the calibration curve with a red diamond marker. No units are shown next to
the reading because you have to know what units you are working in. You can make notes in Step
6 of the units you are working in.
- Apex 785 Raman (1 page)
- STS-UV (2 pages)
- TR2 Engineering Note (4 pages)
- SAD500 Communications and Control (19 pages)
- Red Tide USB650 Install (26 pages)
- Fiber Optic Termination Kit (6 pages)
- Transmissive pH Probe (10 pages)
- Remora (42 pages)
- PlasCalc (59 pages)
- Correcting Device Driver Issues (8 pages)
- ecoVis Krypton Light Source (16 pages)
- LPC-500CM (28 pages)
- HPX-2000 (24 pages)
- ADC1000-USB (27 pages)
- Torus Operating Instructions (30 pages)
- ADC2000-PCI (13 pages)
- Sensors for Real-Time Analysis (2 pages)
- IDRaman reader (2 pages)
- DH-2000-CAL (30 pages)
- QE65 Pro (32 pages)
- Collimating Lenses (2 pages)
- D1000 (2 pages)
- IDRaman mini (2 pages)
- HR2000CG-UV-NIR (42 pages)
- Cool Red (1 page)
- HL-2000 (20 pages)
- XE-1 Xenon (6 pages)
- USB-ADP Serial Adapters (3 pages)
- CHEM2000 (36 pages)
- Deuterium-Halogen Calibration Light Source (19 pages)
- NeoFox Engineering Note (30 pages)
- QE Pro (2 pages)
- OOIBase32 (140 pages)
- AR-1 Argon (6 pages)
- pH Sensor Patches, Probes and Cuvettes (36 pages)
- SpecLine Offline Spectroscopy (60 pages)
- HL-2000-HP-232 (26 pages)
- External Triggering Options Instructions for Spectrometers with Firmware Version 3.0 and Above (16 pages)
- Breakout Box (10 pages)
- USB-ISS-UV_VIS (4 pages)
- ISS-UV_VIS (6 pages)
- OOIColor (14 pages)
- LS-1 Series (12 pages)
- Apex Install (24 pages)
- DH-2000 (34 pages)