3 performance data, Wan ports wan port user screens and settings – Zhone Technologies IMACS-200 User Manual
Page 139

WAN Ports
5-9
WAN ports
WAN port User Screens and Settings
5.3.3
Performance Data
All WAN ports gather performance data. The performance data for a T1 line is viewed by
typing “p” in the WAN port Main Screen, to invoke the Perf command. Performance data is
accumulated for 15-minute increments that include the current period and the previous 96
periods (24 hours), which are accessed via the pgUp and pgDn commands of the Main Screen.
Performance data can be viewed for each WAN port by moving to that port and then selecting
the “p” option.
In an T1 environment, an error is defined as any CRC-4 error, Controlled Slip, or OOF error.
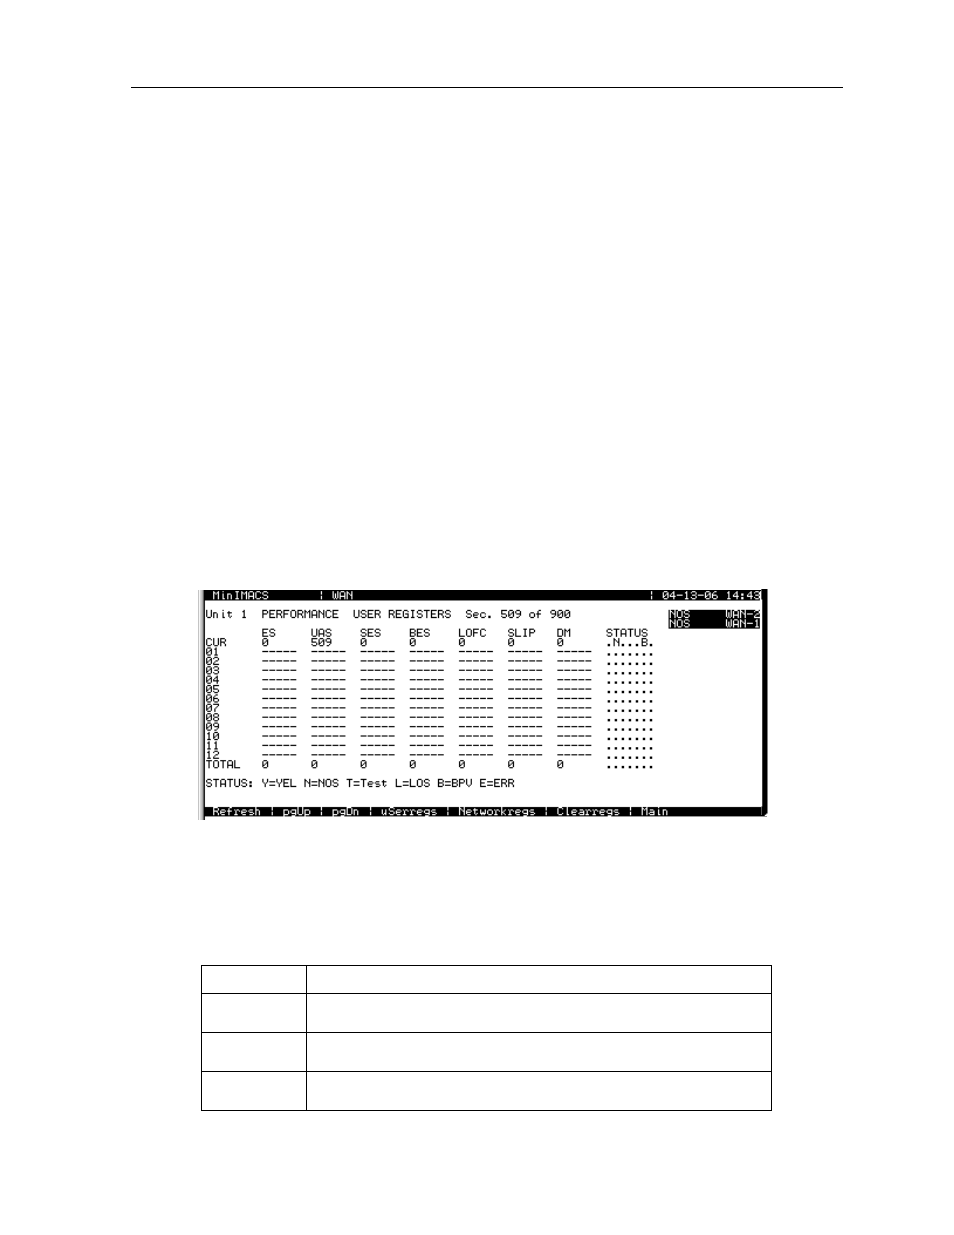
Figure 5-8 shows a typical T1 Performance Data Screen. The performance statistics are
gathered and displayed in 15-minute intervals. Lines in each of the columns represent periods
when no seconds have accumulated.
In the AT&T mode, two sets of registers accumulate performance data for 4 WAN links. The
user registers and network registers are driven by the same errored events. However, they can
be cleared separately. You can view both the user and network registers, but you can only clear
the user registers. The network only has access to the network registers, and can only clear
those registers. The ANSI and T1 WAN links have only one set of registers.
Figure 5-8.Typical Performance Data Screen
Table 6-3 lists the actions available from the Performance Data Screen.
Table 5-3. Performance Data Screen Actions
Action
Function
Refresh
Because statistics are not calculated in real time, the Refresh command
must be used to update the screen with new information.
pgUp
Pages through the performance statistics for the current 15 minute period
and periods 96-1.
pgDn
Pages through the performance statistics for the current 15 minute period
and periods 1-96.
