Panduit DPOE24S1X User Manual
Page 24
PANDUIT® DPoE™ Power Patch Panel User’s Guide
Issue 2.2
Part Number: PN378A
23
Some of the screen shots in this section may look different on the PC running the EM. The updated EM
presents a slightly different look to the screen shots. In some cases, additional features have been added
(refer to the same sections in the DPoE™ 8 Port Power Hub User’s Guide for more details on the added
features).
Graphical User Interface
The PANDUIT
®
Element Manager has an easy-to-use graphical user interface with pull-down menus and
tool bars, which make configuring and provisioning the network easy. When the Element Manager
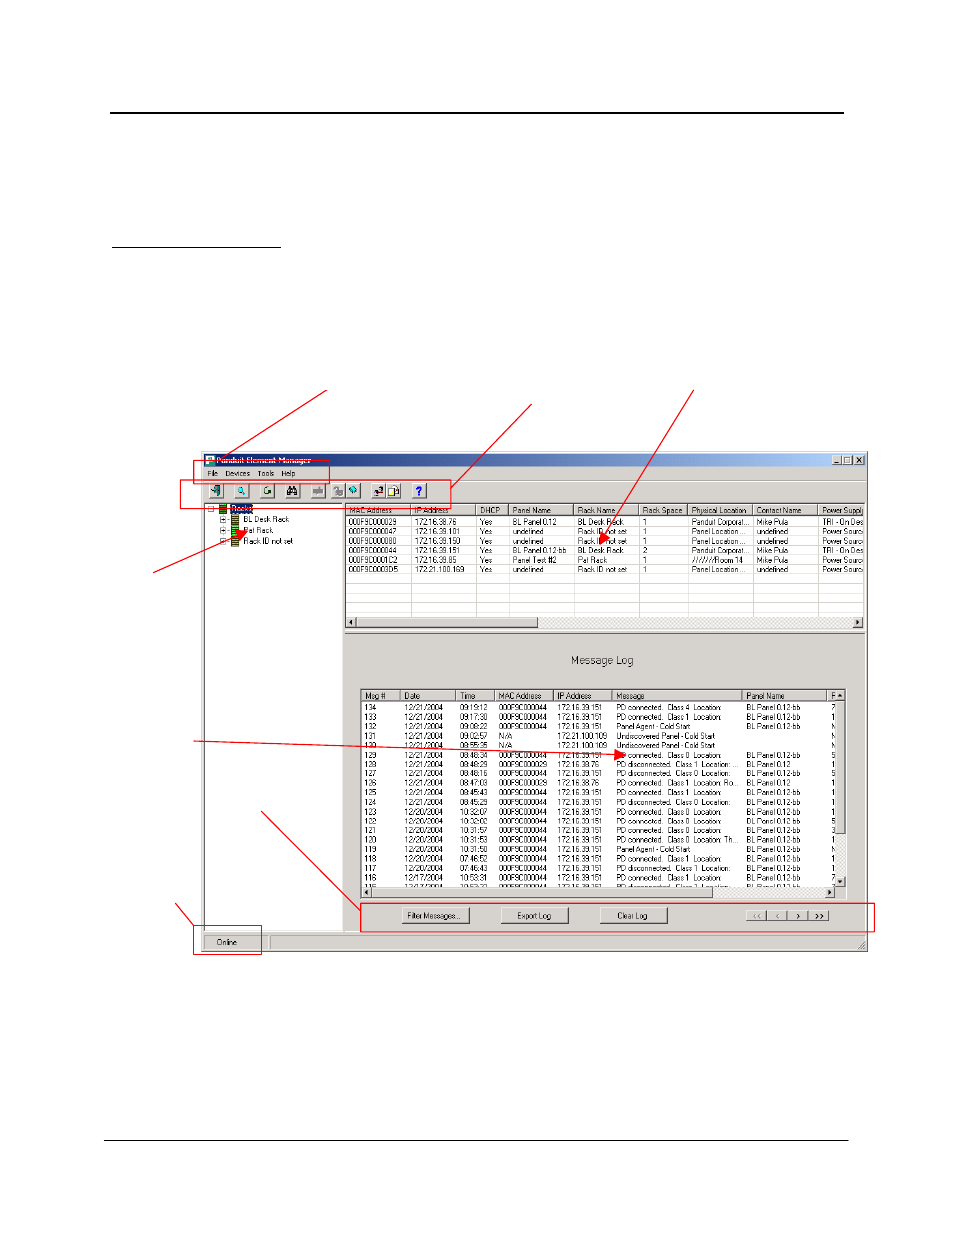
software is opened, the following system-level opening screen appears.
Tree view
of the
network
area
List view of the DPoE
Patch Panels area
Message
log area
Pull-down menus
Tool bar
Tool bar for
message log
Online
indicator
Figure 3: System-Level Opening Screen
The system-level opening screen is broken into three areas: the Tree View of the Network area, the List
View of the DPoE™ Power Patch Panels and the Message Log area. By working in each of these three
areas, the network operator can easily monitor the overall status of the DPoE™ Power Patch Panel
network, the status of individual patch panels, or the status of individual ports on individual panels.
Likewise, configuration changes can be made at the network, panel or port level.