K transforming sampled data to list data – Casio FX-9750GII User Manual
Page 393

20051101
3. Press
w.
• This causes the magnifying glass to disappear and enters the zoom mode.
• The cursor keys perform the following operations in the zoom mode.
4. To exit the zoom mode, press
J.
k Transforming Sampled Data to List Data
Use the following procedure to transform the sampled data in a specific range of a graph into
list data.
u
u
u
u
u
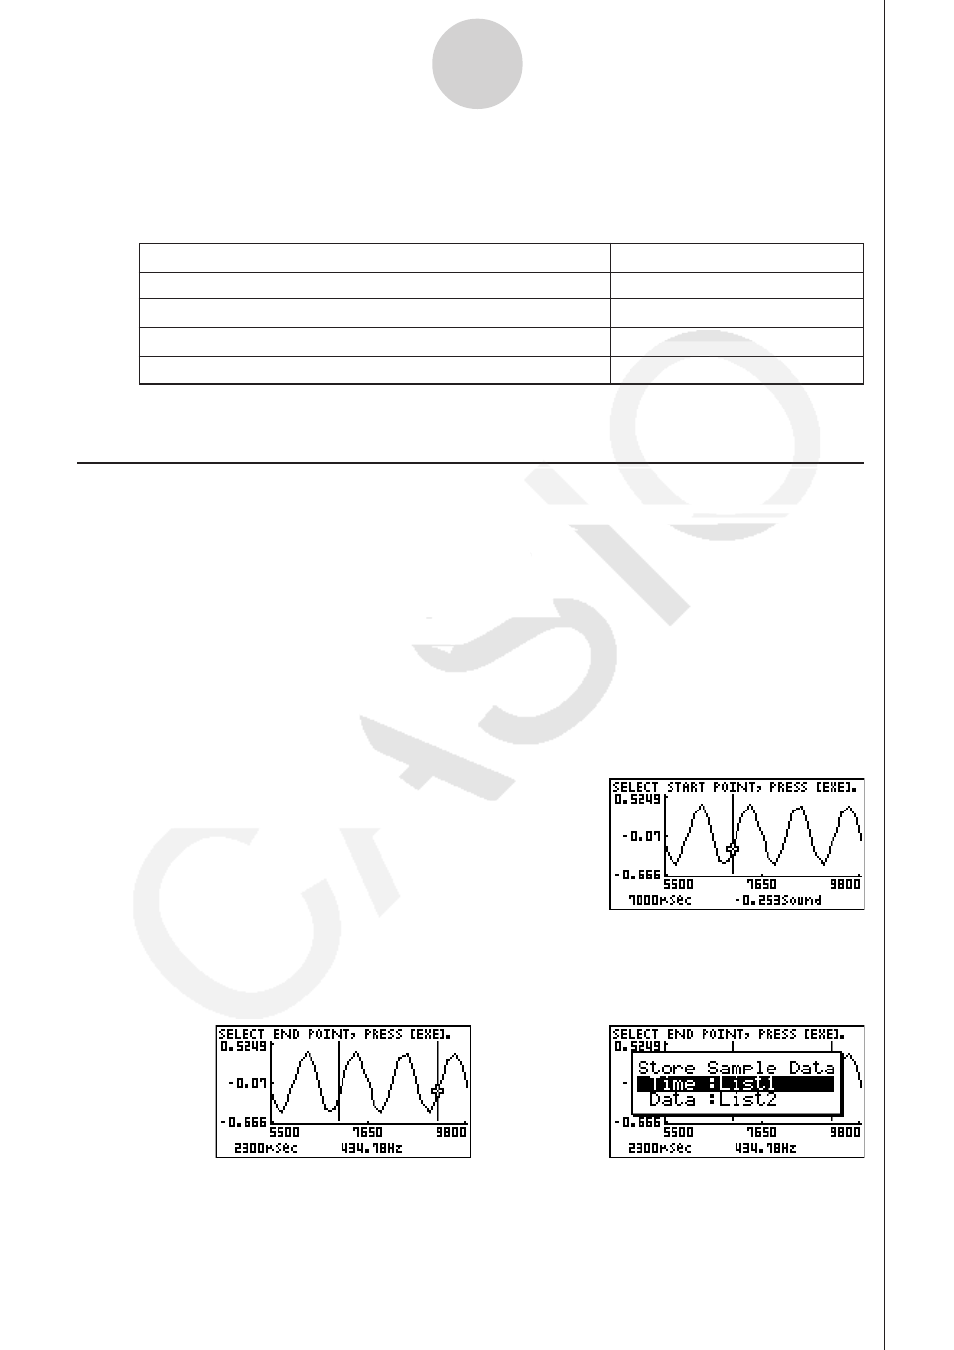
To transform sampled data to list data
1. On the graph screen, press
K, and then 2(LMEM).
• This displays the [LMEM] menu.
2. Press
2(SEL).
• This displays the trace pointer for selecting the range on the graph.
3. Move the trace pointer to the start point of the range you want to convert to list data, and
then press
w.
11-5
Graph Analysis Tool Graph Screen Operations
To do this:
Press this cursor key:
Reduce the size of the graph image horizontally
d
Enlarge the graph image horizontally
e
Reduce the size of the graph image vertically
c
Enlarge the graph image vertically
f
4. Move the trace pointer to the end point of the range you want to convert to list data, and
then press
w.
• This displays a dialog box for specifying the lists where you want to store the time data
and the sampled data.
/
• The initial default lists are List 1 for the time and List 2 for sample data. To change to
another list (List 1 to List 26), use the up and down cursor keys to move the highlighting
to the list you want to change, and then input the applicable list number.
