Chapter 7 statistical graphs and calculations – Casio fx-7400G PLUS Statistical Graphs and Calculations User Manual
Page 6
100
Chapter 7
Statistical Graphs and Calculations
1
2
3
4
1
2
3
4
[
u
uu
u
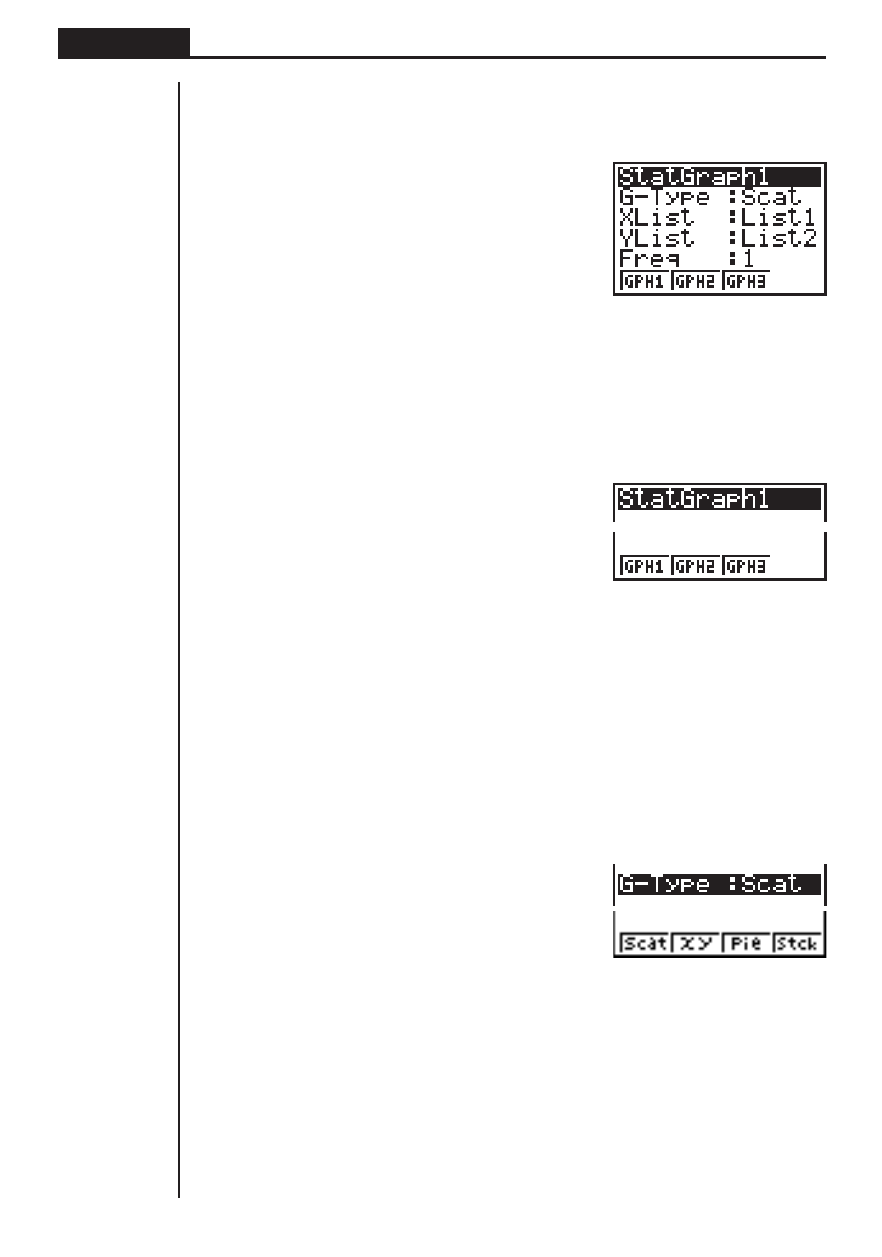
uTo display the general graph settings (SET) screen
While the graph menu is on the display, press [4 (SET) to display the general
graph settings screen.
1(GRPH)
[4(SET)
• The settings shown here are examples only. The settings on your general graph
settings screen may differ.
u
uu
u
uTo select the StatGraph area
1. While the general graph settings screen is on the display, use
f and c to
move the highlighting to the StatGraph item.
2. Use the function key menu to select the StatGraph area you want to select.
1 (GPH1) ..... Graph 1
2 (GPH2) ..... Graph 2
3 (GPH3) ..... Graph 3
u
uu
u
uTo select the graph type (G-Type)
1. While the general graph settings screen is on the display, use
f and c to
move the highlighting to the G-Type item.
2. Use the function key menu to select the graph type you want to select.
1 (Scat) ........ Scatter diagram
2 (
xy
) ...........
xy
line graph
3 (Pie) .......... Pie chart
4 (Stck) ........ Stacked bar chart