Statistical graphs and calculations chapter 7, Kk bar graph and line graph – Casio fx-7400G PLUS Statistical Graphs and Calculations User Manual
Page 19
113
Statistical Graphs and Calculations
Chapter 7
• Pressing ! 1 (TRCE) while a line graph is on the display activates the trace
operation. Use
d and e to move the pointer.
• You cannot draw multiple line graphs on the same screen.
k
k
k
k
k Bar Graph and Line Graph
From the statistical data list, press 1 (GRPH) to display the graph menu, press
[4 (SET), and then change the graph type of the graph you want to use (GPH1,
GPH2, GPH3) to Both.
When Auto is specified for the S-Wind (Statistical Graph View Window Setting) item
on the Set Up screen, you can next move the highlighting to the AutoWin item and
press 1, 2, or 3 to make one of the following settings.
1 (Sep.G) ..... This setting causes each graph to be drawn in different areas
of the display, without superimposing them. The two graphs
share the same
x
-coordinates, however, and the
x
-axis is dis-
played for the bar graph only.
2 (O.Lap) ..... This setting superimposes the two graphs on each other. Each
graph, however, can have its own independent
y
-axis values.
3 (Norm) ...... This setting also superimposes the two graphs, with both us-
ing the same
x
- and
y
-coordinates.
Press Q to draw the graph.
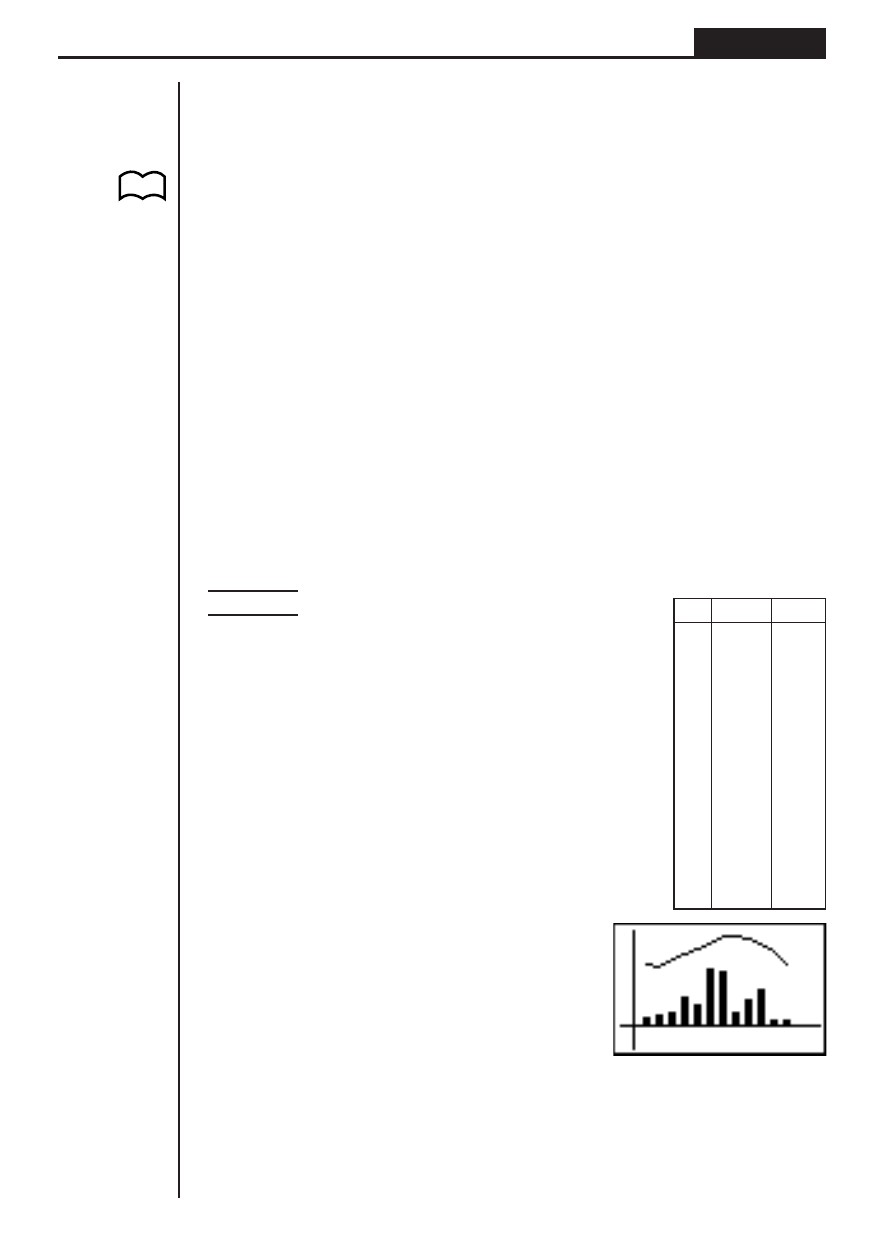
Example
Draw a graph that shows precipitation in
a certain city as a bar graph and average
temperature as a line graph.
Input the precipitation data into List 1 and
the temperature data into List 2. Use the
following procedure to draw the graph.
1(GRPH)[4(SET)
1(GPH1)c
[[[[3(Both)c
1(List1)c
2(List2)c
1(Sep.G)Q
1(GRPH)1(GPH1)
• Pressing ! 1 (TRCE) while the graph is on the display activates the trace
operation. Use
d and e to move the pointer.
• You cannot draw multiple bar and line graphs on the same screen.
List 1
List 2
1
100
5
2
150
4
3
200
11
4
400
16
5
300
20
6
800
24
7
750
31
8
200
32
9
350
29
10
500
24
11
80
18
12
80
6
P.101
(G-Type)
(Both)
P.8